Temporal Coordination of Measurement in Data Centers

MOZART: Temporal Coordination
of Measurement
(SOSR’ 16)
Xuemei Liu
, Meral Shirazipour,
Minlan Yu, Ying Zhang


1


Measurement in data center
•
Incentive examples of measurement
–
Fault diagnosis: Capture root causes for failures.
–
Traffic engineering: Capture statistics for big flows.
–
Attack detection: Capture signatures of attacks.
•
Essence of measurement
–
Capture
data
related to
events
.
2
Different views/abilities of devices
3
View:
p
er source/destination traffic
Abilities:
end-2-end loss, latency, etc.
hosts
switches
View:
p
er link traffic
Abilities:
per link
volume, latency, etc.
No-coordination of measurement
Controller
4
Limited resource
may be
utilized
by
flows not related to the event
.
Too much
reporting overhead
We propose
temporal coordination
of
measurement
Measure & report
loss of
all flows
Measure & report
flow volume of
all flows
S0
S1
S2
Example1 – loss detection
5
Traffic flow
•
Packet loss affects performance.
•
Operators want to locate the loss.
No-coordination
Detect high loss
for some flows
Measure & report
flow volume of
only lossy flows
S0
S1
S2
Example1 - loss detection
6
Selected flows
Traffic flow
•
Packet loss affects performance.
•
Operators want to locate the loss.
Coordination
Sender needs to
coordinate the lossy flows
with switches.
Example2 - port s
can
Count & report
number of destinations
for
all senders
S0
S1
Compromised sever
Port: 123
Port: 456
Port: 789
7
Traffic flow
•
Compromised servers
detect vulnerable servers
.
No-coordination
Count & report
number of destinations
for
detected sender
Detect senders with unwanted
traffic sent to secure ports
S0
S1
Http server (80)
Compromised sever
Port: 123
Port: 456
Port: 789
8
Selected flows
Traffic flow
•
Compromised servers detect vulnerable servers.
Example2 - port s
can
Coordination
Egress switch
coordinates
candidate compromised senders
with ingress switch
Example3 - ECMP f
low
Measure & report volume of
all flows
S1
S0
S2
9
•
Facebook reported congestion caused by unbalanced
ECMP traffic distribution.
Traffic flow
No-coordination
Example3 - ECMP f
low
Detect elephant flows
Measure & report volume of
elephant flows
S1
S0
S2
10
•
Facebook reported congestion caused by unbalanced
ECMP traffic distribution.
Selected flows
Traffic flow
Coordination
Switches coordinate
elephant flows
with each other
MOZART
MO
nitor flow
Z A
t the
R
ight
T
ime
11
MOZART framework
MOZART controller
selector
selector
monitor
monitor
Report data of
selected flows
Configure
Selected flows
Detect events
Capture data related
to events
12
MOZART design challenges
•
Coordination measurement
•
Placement of MOZART tasks
13
MOZART design challenges
•
Coordination measurement
•
Placement of tasks
14
…
Strawman Coordination
15
f1 in Selector
:
f1 in Monitor
:
…
Normal packet
f1 is selected
TIME
f
1
s
a
t
i
s
f
i
e
s
t
h
e
e
v
e
n
t
…
Strawman Coordination
16
f1 in Selector
:
f1 in Monitor
:
…
Normal packet
Captured packet
…
Traffic before selected
is not captured
f1 is selected
TIME
f
1
s
a
t
i
s
f
i
e
s
t
h
e
e
v
e
n
t
Event Mode
Normal Mode
…
Two-mode Coordination
17
f1 in Selector
:
f1 in Monitor
:
…
Normal packet
TIME
Captured packet
…
f1 is selected
Sampling
in
Normal Mode
Sampled packet
Traffic
before selected
has
a chance to be captured
.
f
1
s
a
t
i
s
f
i
e
s
t
h
e
e
v
e
n
t
Memory management in monitors
Flow ID
Selected flow?
Flow statistics
f1
1
10240
f2
1
2048
f3
0
500
f7
18
•
Selected flows, non-selected flows coexist in hash table.
•
Limited memory in devices.
•
Collision may happen in hash table.
Selected flows
Memory management in monitors
19
Flow ID
Selected flow?
Flow statistics
f1
1
10240
f2
1
2048
f7
1
1024
f7
Selected flows
•
Selected flows, non-selected flows coexist in hash table.
•
Limited memory in devices.
•
Collision may happen in hash table.
Memory management in monitors
Flow ID
Selected flow?
Flow statistics
f1
1
10240
f2
1
2048
f7
1
1024
f5
f7
f6
20
Selected flows
Non-selected flows
More memory
is allocated to
selected flows
.
•
Selected flows, non-selected flows coexist in hash table.
•
Limited memory in devices.
•
Collision may happen in hash table.
MOZART design challenges
•
Coordination measurement
•
Placement of
MOZART
tasks
21
Placement of
MOZART
tasks
•
Many candidate MOZART tasks to run
–
Operators want to detect many events.
•
Device Resource Constraints
–
Switches: limited memory; Hosts: limited CPU.
–
Measurement can just use leftover resources.
•
Latency constraint within one MOZART task
–
Timely communication is critical.
–
Latency between selectors/monitors should be small.
22
•
Strawman algorithm
–
Maximize Allocated Modules (MAM).
•
Challenges
–
One task - Selectors and monitors should all be placed.
–
Multiple tasks - Joint placement to max running tasks.
•
MOZART- Binary Integer Linear Programming
–
Objective - Maximize the number of tasks to run.
–
Subject to resource and latency constraints.
23
Placement of
MOZART
tasks
Evaluation Setup
•
Topology & Traffic
–
B4 top
ology
(12 switches, 12
hosts
).
–
Implemented in
Mininet.
–
Switches run Open vSwitch.
–
2 hours Caida trace.
•
Compared algorithms
–
No-coordination - Just Sample and Hold (SH) in monitors.
–
Coordination - Selectors sends selected flows; SH in monitors.
24
High loss for some flows
measure flow volume of lossy flows
S0
S1
S2
Example – loss detection
25
Selected flows from selector
Traffic flow
selector
monitor
monitor
monitor
MOZART achieves high accuracy
26
15%
1.3%
Ratio of selected
flows not captured
Memory size in each
monitor for measurement
MOZART supports more tasks
27
MOZART supports more tasks
28
Conclusion
•
Temporal coordination is important
–
Collect data related to events.
–
Different views/abilities of devices.
•
MOZART design highlights
–
Coordination algorithms.
–
Placement algorithm for maximizing tasks to run.
•
Benefits
–
High measurement accuracy.
–
Support more tasks.
–
Meet memory constraints in devices.
29
Communication between selectors
and monitors
•
Same path
–
Tag following packets of selected flows.
•
Reverse path
–
Tag reverse packets of selected flows.
•
Different path
–
Send explicit packets.
30
Thanks for the introduction. Today I am going to show our work …
This is a collaborative work among, university of Southern California, Ericsson and HP Labs.
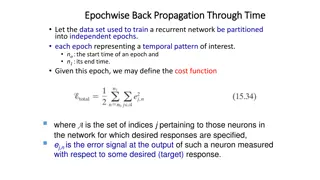
Measurement plays a crucial role in data centers for fault diagnosis, traffic engineering, and attack detection. This study focuses on the concept of temporal coordination of measurement to overcome issues like reporting overhead and resource wastage. Various examples illustrate the importance of coordinated measurement in scenarios such as loss detection and port scanning to enhance network performance and security.

Download Presentation

Please find below an Image/Link to download the presentation.
The content on the website is provided AS IS for your information and personal use only. It may not be sold, licensed, or shared on other websites without obtaining consent from the author.If you encounter any issues during the download, it is possible that the publisher has removed the file from their server.
You are allowed to download the files provided on this website for personal or commercial use, subject to the condition that they are used lawfully. All files are the property of their respective owners.
The content on the website is provided AS IS for your information and personal use only. It may not be sold, licensed, or shared on other websites without obtaining consent from the author.
E N D
Presentation Transcript
MOZART: Temporal Coordination of Measurement (SOSR 16) Xuemei Liu, Meral Shirazipour, Minlan Yu, Ying Zhang 1
Measurement in data center Incentive examples of measurement Fault diagnosis: Capture root causes for failures. Traffic engineering: Capture statistics for big flows. Attack detection: Capture signatures of attacks. Essence of measurement Capture data related to events. 2
Different views/abilities of devices View: per source/destination traffic Abilities: end-2-end loss, latency, etc. View: per link traffic Abilities: per link volume, latency, etc. switches hosts 3
No-coordination of measurement Controller Too much reporting overhead Limited resource may be utilized by flows not related to the event. We propose temporal coordination of measurement 4
Example1 loss detection Packet loss affects performance. Operators want to locate the loss. Measure & report flow volume of all flows Measure & report loss of all flows S1 S2 S0 Traffic flow No-coordination 5
Example1 - loss detection Packet loss affects performance. Operators want to locate the loss. Measure & report flow volume of only lossy flows Detect high loss for some flows S1 S2 S0 Selected flows Traffic flow Coordination Sender needs to coordinate the lossy flows with switches. 6
Example2 - port scan Compromised servers detect vulnerable servers. Count & report number of destinations for all senders Port: 456 Port: 123 S0 S1 Compromised sever No-coordination Port: 789 Traffic flow 7
Example2 - port scan Compromised servers detect vulnerable servers. Detect senders with unwanted traffic sent to secure ports Count & report number of destinations for detected sender Port: 456 Port: 123 S0 S1 Http server (80) Compromised sever Egress switch coordinates candidate compromised senders with ingress switch Coordination Port: 789 Traffic flow 8 Selected flows
Example3 - ECMP flow Facebook reported congestion caused by unbalanced ECMP traffic distribution. Measure & report volume of all flows S0 S1 No-coordination S2 Traffic flow 9
Example3 - ECMP flow Facebook reported congestion caused by unbalanced ECMP traffic distribution. Measure & report volume of elephant flows Detect elephant flows S0 S1 Switches coordinate elephant flows with each other Coordination S2 Traffic flow Selected flows 10
MOZART MOnitor flowZ At the Right Time 11
MOZART framework MOZART controller Capture data related to events Configure Detect events monitor Report data of selected flows selector selector monitor Selected flows 12
MOZART design challenges Coordination measurement Placement of MOZART tasks 13
MOZART design challenges Coordination measurement Placement of tasks 14
Strawman Coordination TIME f1 satisfies the event f1 in Selector: f1 is selected f1 in Monitor: Normal packet 15
Strawman Coordination TIME f1 satisfies the event f1 in Selector: f1 is selected f1 in Monitor: Traffic before selected is not captured Normal packet Captured packet 16
Two-mode Coordination Event Mode Normal Mode TIME f1 satisfies the event f1 in Selector: f1 is selected Sampling in Normal Mode f1 in Monitor: Normal packet Traffic before selected has a chance to be captured. Captured packet 17 Sampled packet
Memory management in monitors Selected flows, non-selected flows coexist in hash table. Limited memory in devices. Collision may happen in hash table. Selected flows f7 f1 f2 Flow ID f3 1 1 0 Selected flow? Flow statistics 10240 2048 500 18
Memory management in monitors Selected flows, non-selected flows coexist in hash table. Limited memory in devices. Collision may happen in hash table. Selected flows f7 f1 f2 Flow ID f7 1 1 1 Selected flow? Flow statistics 10240 2048 1024 19
Memory management in monitors Selected flows, non-selected flows coexist in hash table. Limited memory in devices. Collision may happen in hash table. Non-selected flows Selected flows f5 f6 f7 f1 f2 Flow ID f7 1 1 1 Selected flow? More memory is allocated to selected flows. Flow statistics 10240 2048 1024 20
MOZART design challenges Coordination measurement Placement of MOZART tasks 21
Placement of MOZART tasks Many candidate MOZART tasks to run Operators want to detect many events. Device Resource Constraints Switches: limited memory; Hosts: limited CPU. Measurement can just use leftover resources. Latency constraint within one MOZART task Timely communication is critical. Latency between selectors/monitors should be small. 22
Placement of MOZART tasks Strawman algorithm Maximize Allocated Modules (MAM). Challenges One task - Selectors and monitors should all be placed. Multiple tasks - Joint placement to max running tasks. MOZART- Binary Integer Linear Programming Objective - Maximize the number of tasks to run. Subject to resource and latency constraints. 23
Evaluation Setup Topology & Traffic B4 topology (12 switches, 12 hosts). Implemented in Mininet. Switches run Open vSwitch. 2 hours Caida trace. Compared algorithms No-coordination - Just Sample and Hold (SH) in monitors. Coordination - Selectors sends selected flows; SH in monitors. 24
Example loss detection measure flow volume of lossy flows High loss for some flows monitor monitor monitor S1 S2 S0 selector Selected flows from selector Traffic flow 25
MOZART achieves high accuracy Ratio of selected flows not captured 15% 1.3% Memory size in each monitor for measurement 26
MOZART supports more tasks Algorithms tasks assigned(%) Avg. latency(ms) Maximize Allocated Modules 77% 94 MOZART (Latency <= infinite) 100% 110 27
MOZART supports more tasks Algorithms tasks assigned(%) Avg. latency(ms) Maximize Allocated Modules 77% 94 MOZART (Latency <= infinite) 100% 110 MOZART (Latency <= 250ms) 98% 64 28
Conclusion Temporal coordination is important Collect data related to events. Different views/abilities of devices. MOZART design highlights Coordination algorithms. Placement algorithm for maximizing tasks to run. Benefits High measurement accuracy. Support more tasks. Meet memory constraints in devices. 29