Understanding Weather Station Data and Atmospheric Pressure Basics
Explore essential concepts in meteorology including weather station instrumentation, atmospheric pressure determination, weather map basics, and isotherm plotting. Learn about interpreting weather station models, identifying pressure systems, and understanding isotherms for temperature analysis on weather maps.

Download Presentation

Please find below an Image/Link to download the presentation.
The content on the website is provided AS IS for your information and personal use only. It may not be sold, licensed, or shared on other websites without obtaining consent from the author. Download presentation by click this link. If you encounter any issues during the download, it is possible that the publisher has removed the file from their server.
E N D
Presentation Transcript
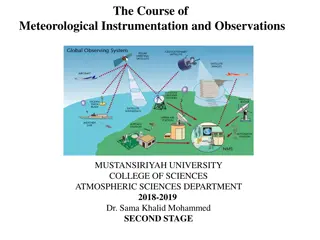
Station Plot and Instrumentation Review AOSC200 0201, 0103 TA: Hannah Daley atmos.umd.edu/~hmdaley/AOSC200/ 1
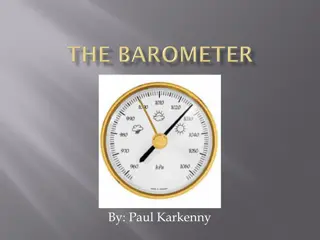
Weather Station Model For quizzes and Exams you should know: Dew point Temp 100% relative humidity: Dew Point=Temp General sense of fastest wind speeds General sense of cloud coverage DO NOT MEMORIZE CURRENT WEATHER Determine atmospheric pressure in 3 easy steps: 1. Move the decimal once to the left 120 12.0 2. If value is less than 50, add 10 to the front 12.0 1012.0 mbar 3. If value is greater than 50, add 9 to front 2
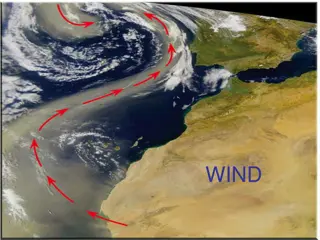
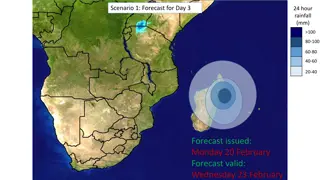
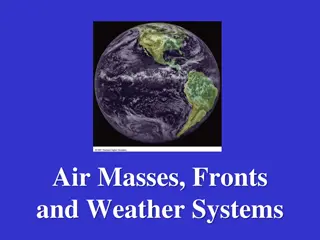
Weather Map Basics- Surface Pressure Types High Pressure (H): Associated with stagnant and hot conditions Low Pressure (L): Associated with fronts and stormy conditions Extreme Low Pressure Conditions: Heavy rain, strong winds, storm surge and flooding 3
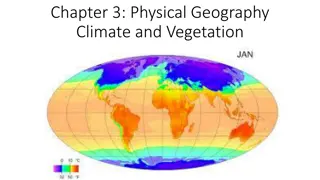
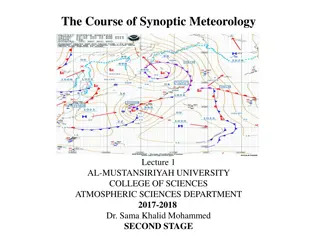
Weather Map Basics- Plotting Isotherms Isotherm: A line of constant temperature 4