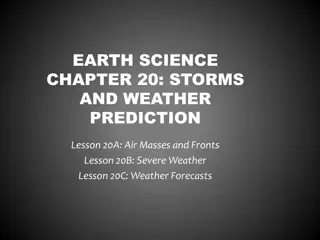
Evolution in Identifying High-Impact Weather Events since February 1979
Evolution in identifying high-impact weather events since 18-19 February 1979 discusses the advancements in identifying significant weather events. The article highlights the influence of standardized anomalies in recognizing features associated with extreme weather, aiding in the accurate identification of high-impact events. Various contributors have provided insights into improving the identification of large-scale weather phenomena, such as snowstorms and storms like Sandy. By leveraging traditional methodologies and modern data analysis techniques, researchers are enhancing the understanding and prediction of severe weather occurrences.

Download Presentation

Please find below an Image/Link to download the presentation.
The content on the website is provided AS IS for your information and personal use only. It may not be sold, licensed, or shared on other websites without obtaining consent from the author. Download presentation by click this link. If you encounter any issues during the download, it is possible that the publisher has removed the file from their server.
E N D
Presentation Transcript
Evolution in identifying High Impact Weather Events since 18-19 February 1979 Richard H. Grumm National Weather Service State College, PA Contributions: Trevor Alcott WR/SSD Randy Graham WR/Salt Lake City Robert Hart FSU
The greatest snowstorm in more than half a century left the Washington area smothered under at most two feet of snow yesterday a magnificent white menace that virtually imprisoned the city and sent road crews battling to reopen streets for this morning s commuters. Wash. Post 1979 1970s Traditional view Using R-Analysis
R-Climate and HIWE Traditional Standardized anomalies facilitate identifying features associated with significant high impact weather events Remove the guessing improving identification of larger scale high impact weather events (HIWE)
R-Climate and HIWE Traditional Standardized anomalies facilitate identifying features associated with significant high impact weather events Remove the guessing improving identification of larger scale high impact weather events (HIWE) Now we can leverage the full PDF find extreme outliers
The Mean Sea-level Sandy if we know the PDF and the forecast automation can provide alerts to extreme events in tails of any distribution 140 NYC 850 hPa u-wind anomalies 120 100 80 60 40 Frequency 20 0 -8 -7 -6 -5 -4 -3 -2 -1 -7.5 -6.5 -5.5 -4.5 -3.5 -2.5 -1.5 -0.5 -3.01981E-14 1 2 3 4 0.5 1.5 2.5 3.5
R-Climate and Forecasts Simulation 0000 UTC 17 February 1979 Use 3-4 images from WRF-EMS runs for brevity (runs completed in grib2) Traditional MSLP and QPF MSLP with Standardized anomalies Surface cyclone was not so impressive anticyclone was! Show GEFS traditional Superstorm images
R-Climate The WRF simulations nailed the -6 LLJ Critical feature with historic East Coast winter storms WRF nailed the massive anticyclone Nailed snow too but not enough time to show Standardized anomalies analysis had proven to be of great use in identifying high impact weather events in recent years. They would have been of Great Value in 1979 too!
GEFS-R For another case No good data available for this event But have a proxy event 13-14 March 1993
GEFS-R Proxy case March 1993 superstorm
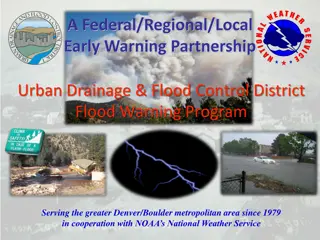
Leveraging the full R-Climate PDF works with automation/bots Current NWS has WR-Situational Awareness Identifies strongly forced high impact events IDSS for significant large scale events Could provide inputs for Algorithms Extreme forecast indices R-Climate based Extreme weather alerts regional and locally Exploitable PDF EFS and EFS PDF verse R-Climate
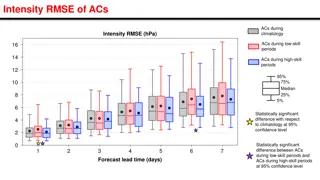
120 hour Forecast Valid 00Z Mar 14 1993 Zonal Wind Anomalies 850 hPa 700 hPa 120 hour forecast 700 hPa: -3 to -4 850 hPa: -4 to -5 Significant values at 120 hours 72 hour Forecast Valid 00Z Mar 14 1993 72 hour forecast -4 to -5 at both 700 & 850 hPa 700 hPa 850 hPa 24 hour Forecast Valid 00Z Mar 14 1993 24 hour forecast 700 hPa: -4 to -5 850 hPa: 5 to -6 Displaced to the northwest 700 hPa 850 hPa
Model Climate (M-Climate) Probability distribution functions from EFS or single model EFS and M-Climate based EFI When is model predicting a record or near record event Another means to add value to the forecast Another HIWE alert opportunity QPF is the best starting point for this activity
As we move foreword Leveraging seemingly disparate datasets We can improve identification of high impact weather events and thus decision support activities Tools but the forecaster over the process Lends well to automation and automated alerts Where to focus activities and resources Few surprises


")