Understanding Regression Analysis through Hot Chocolate Cooling Experiment
Explore the process of regression analysis using a hot chocolate cooling experiment. Gather data, plot graphs, calculate r values, discuss results, and consider transformations to analyze temperature changes over time accurately.

Download Presentation

Please find below an Image/Link to download the presentation.
The content on the website is provided AS IS for your information and personal use only. It may not be sold, licensed, or shared on other websites without obtaining consent from the author. Download presentation by click this link. If you encounter any issues during the download, it is possible that the publisher has removed the file from their server.
E N D
Presentation Transcript
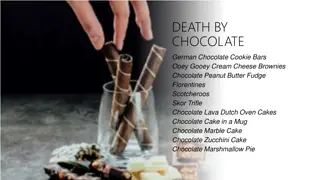
HOT CHOCOLATE COOLING An Exercise in Regression
Hot Chocolate Cooling Time Tempre... <new> FIRST, COLLECT THE DATA 0 147.2 1 1 144.7 2 2 142.2 3 3 140.2 4 4 138.0 5 I borrow thermometers from the science teachers and bring a LARGE container of hot water. Reserve the hot chocolate mix for drinking, not temperature taking 5 136.2 6 6 133.9 7 7 131.9 8 8 130.3 9 9 128.8 10 10 127.4 11 11 125.8 12 12 124.7 13 13 123.3 14 14 122.0 15 15 120.6 16 16 119.3 17 17 118.4 18 18 117.2 19 19 115.9 20 20 115.0 21
NEXT, PLOT THE DATA I have students use fathom or, more often, calculators to graph the data & calculate the r value & the regression equation.
JUST A HINT THIS WATER WAS MUCH TOO HOT! You probably notice a curve in the scatterplot that curve is MUCH less noticeable if you start the temperature a bit cooler. Somewhere around 100 F is about right
THEN, TALK ABOUT THE RESULTS r2= 0.98 what does this mean? What is r ? We can extrapolate! The equation from this model predicts the temperature after 2 hours to be -44 F. Is this a problem?
BUT YOU MUST INCLUDE Even if you start at a lower temperature where the curve isn t noticeable, and even with the high r value (r=-0.9899), the context and the residual plot clearly shows a non-linear pattern!