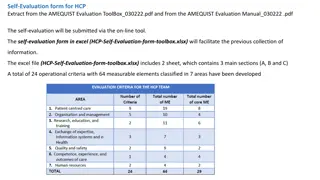
Community Relationship Mapping Tool for Organizational Assessment
Designed to support organizations in assessing relationships with various constituencies and networks, the Community Relationship Mapping Tool increases awareness of social groups influencing decisions in a community. Regular use enhances self-reflection on an organization's position in the system, with recommendations for diverse collaborators to participate in mapping activities. Pre-work guidance, time estimates, and suggestions for utilizing the tool in-person or virtually enhance its usability.

Uploaded on Jul 13, 2024 | 1 Views
Download Presentation

Please find below an Image/Link to download the presentation.
The content on the website is provided AS IS for your information and personal use only. It may not be sold, licensed, or shared on other websites without obtaining consent from the author. Download presentation by click this link. If you encounter any issues during the download, it is possible that the publisher has removed the file from their server.
E N D
Presentation Transcript
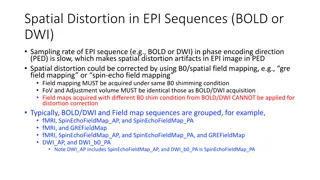
Community Relationship Map This tool was designed to support your organization in assessing its relationship to different constituencies and networks. It can be most useful when utilized on a regular basis to increase your awareness of the social groups that shape major decisions in your defined community, and help you self- reflect on your organization s location in that system.
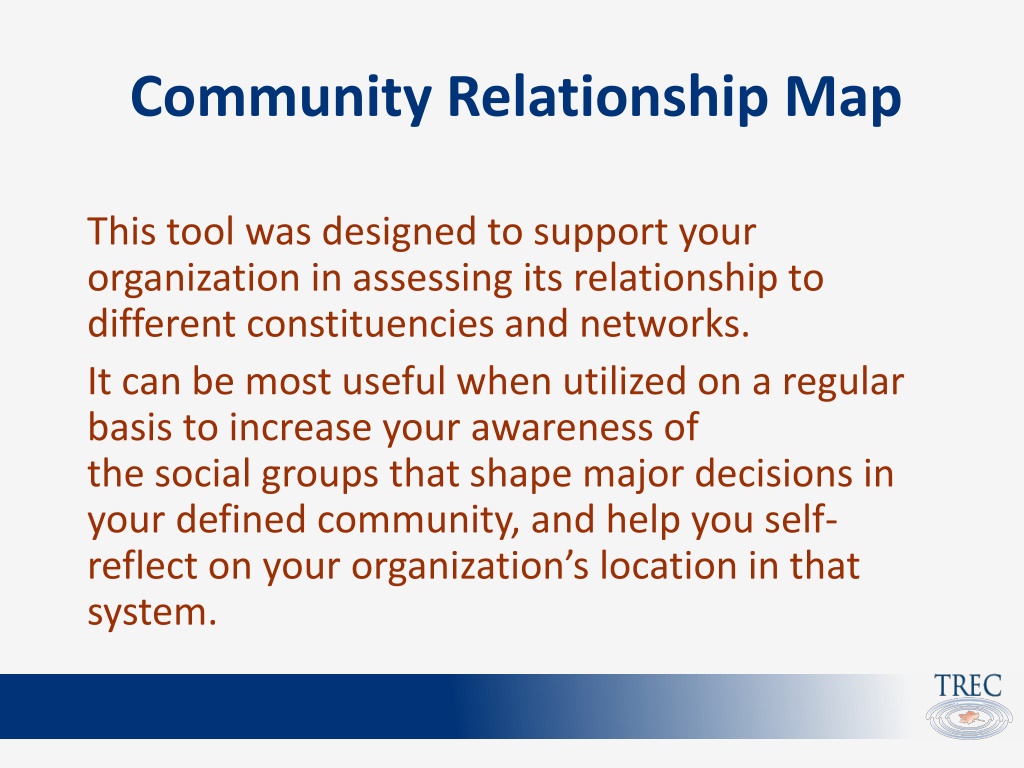
Economic Affinity Groups BIPOC Tea party 0 Alcoa Neighbor Assoc's Ranchers Hmong Comm. Center Refuge es Center 1 Kaiser Permanente (hospital) Ski Young nonpr ofit league PTA Resort Land trust 2 Latino Arts Tribal Center MADD Mtn Bike Assoc CJA Tourism Assoc 3 SEIU BLM 5280 Audub on 4 Water shed Alliance PSR 5 MY ORGANIZATION Example of a completed map
Who Should Use This We recommend inviting a diverse group of collaborators to participate in this mapping activity, and suggest that you consider diversity according to Organizational tenure and role (eg: Program Director, volunteer, most senior Board member) Social identities (eg: cultural/ethnic minority groups, gender, age) Participation in other networks or groups (eg: Sierra Club, Parent Teacher Associations, Immigrant Rights Groups)
Time and Materials Expect to spend 1-4 hours on this activity, depending on how many collaborators you invite in the process. Collaborators can engage this tool in person using flipcharts, whiteboards, or chalkboards by following the outlined steps. For virtual collaboration, we recommend converting this into a shareable Google Slide for others to access and contribute to.
Pre-Work Know your goals and define your geography Be clear about your vision and long-term power building goals Ensure your goals are rooted in your mission and values Identify the geographies (cities, counties, etc.) where your movement needs to increase its social power to change public sentiment or influence decision-makers Obtain any data available about who lives in your defined geography. Begin with demographic records and any other data, such as employment studies, party membership, voter turnout, etc. Census.gov is a good place to start Recognize that some minority and immigrant communities may be undercounted in official records, especially those at risk for deportation. Adjust your map accordingly.
Brainstorm Geographically: Economically: Affinities & Interests: How do people spend their free time? How and where do families spend time together? What are young people doing? Religious, faith, cultural centers? Who brings these people together, where do they connect, etc.? Media sources: Are there community specific media sources for specific interests, demographics, people who speak a specific language, etc.? Rural, urban, suburban? How do people make a living? Are you looking to build power in a specific region, city, or neighborhood? Are there large numbers of people who work for a single company or sector? How do people in those geographies identify them selves and how do they connect with one another? Are there associations, organizations, or publications for these communities?
Consider under-representation After brainstorming, look back to your demographic info and determine what you don t know. Are there underrepresented communities in your geography and are you lacking information about where they work, connect, etc.? Make note of what you don t know and look for ways to learn more about your entire community.
Filling in Circles for networks The circles on the next slide will represent the networks, groups, and affiliations you brainstormed. How large is the reach of these groups? For example, if you are working in a single city, a small circle might reach dozens of people, medium reaching hundreds, and a large one thousands. The scale depends on the scope of your defined community. What is the strength of their influence? For example, the leaders of a particular religious community or labor union may have a lot of influence with the folks in their community. A mountain biking association may have less with theirs. Shade the circles by how strong you believe their influence to be with their networks.
Name Name Name Name Name Name Name Name Name Name Name Name Name Name Name Name Name Name Name Name Name Name Name Name Name Name Name Name Name Name Name Name Name Name Name Name Name NameName Name Name Name Name Name Name Name NameName Name Name Name Duplicate this slide if you need more circles; copy the elements from this slide to place on map slide when you are ready
Place Groups on the Map Place the circles on the map along the Y-axis in relation to your organization. Feel free to customize what these levels indicate. For example, 0 = you have an antagonistic relationship 1 = no relationship 5 = closest partner; you actively communicate, collaborate, and there is strong trust, etc. You may not have any 5s yet, and that s ok Place groups in the colored columns that identify them as rooted in an economic basis, other interest/affinity, or representing Black, Indigenous, and other people of color (BIPOC) communities You can customize these categories; however, these categories likely reflect most community interests. We strongly recommend retaining one column for BIPOC communities to keep them visible and part of your consideration.
Economic Affinity Groups BIPOC 0 1 2 3 4 5 MY ORGANIZATION Feel free to zoom in and out to view this slide with more detail as you fill it in, especially if you need to adjust circle sizes to accommodate all your groups.
Your Community Relationship Map Remember, the purpose of this tool is to help you reflect on your relationships with others, and the community at large, in order to help you set goals for the relationships you hope to have. This tool is a living document; it should evolve as your relationships evolve. This tool is not a scorecard. The goal isn t to have all 5s as much as it is to have a better understanding of the social power in your community. Always be asking yourself: Are there communities, networks, or demographics missing from your map? Do you have relationships that allow you to better understand the priorities of different groups as well as the ability to communicate with them? How would the movement benefit if some of these communities had larger networks or more influence? What might you do to support them?