Enhancing Performance with Business Process Mapping

Explore the significance of business process mapping in optimizing performance through detailed insights into process mapping, types of business process maps, common pitfalls, and strategies for leveraging this tool for transformation and process enhancement. Uncover the essentials of documenting, analyzing, and redesigning business processes to drive effectiveness and efficiency.

Download Presentation

Please find below an Image/Link to download the presentation.
The content on the website is provided AS IS for your information and personal use only. It may not be sold, licensed, or shared on other websites without obtaining consent from the author. Download presentation by click this link. If you encounter any issues during the download, it is possible that the publisher has removed the file from their server.
E N D
Presentation Transcript
OPTIMISING PERFORMANCE THROUGH IN-DEPTH PROCESS MAPPING KK Lim Managing Consultant BP+ Pte. Ltd. Enabling Effectiveness and Efficiency 1
Content What is Business Process Mapping? Why is it required? Types of Business Process Maps Common Pitfalls in Process Mapping How to leverage on Business Process Mapping in your transformation / process improvement initiative? Enabling Effectiveness and Efficiency 2
What is Business Process Mapping? Visual description of business process, related activities, input and output Model of the business process Governance Supplier Input Process Customer Output Resources Enabling Effectiveness and Efficiency 3
Why is it Required? Document the business process, which could include the operations/activities, inputs, outputs and roles involved in the business process. Provide an official reference on the business process and a common understanding of what is involved. Facilitate the analysis of current process (As-Is) and redesign of improved process (To-Be). Aid in the identification of critical process parameters. Enabling Effectiveness and Efficiency 4
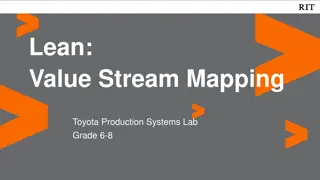
Types of Business Process Maps Process can be modelled at different levels, from the high strategic level to the operational / tactical level. Variety of process maps and methodologies: Process Landscape Diagram Supplier-Input-Process-Output-Customer (SIPOC) Diagram Process Flow Diagram Swim-lane Flow Chart Process Flow with RACI matrix Value Stream Map Enabling Effectiveness and Efficiency 5
Standard Convention in Process Mapping Operation Decision On-page Connector Start / End Off-page Connector Sub-process Document Input / Output End-to-end Process Enabling Effectiveness and Efficiency 6
Process Landscape Diagram - - Based on Porter s value chain concept Typically formulated based on strategic intent of the business Enabling Effectiveness and Efficiency 7
Process Landscape Diagram Vision to Plan Market to Business Idea to Technology Core processes Idea to Product Demand to Stock Order to Cash Finance & Accounting Human Resources Relations Management Infrastructure Management Purchasing Enabler processes Enabling Effectiveness and Efficiency 8
Process Landscape Diagram: Next Level of Granularity Market analysis Sales/marketing strategy Acquisition & BOD Design In to Contract Portfolio management Customer care Sales strategy & plan Target customers and applications Classified customers Customer development plan Allocation plan Design win/loss Contract Customer requirements Business Ideas Design In opportunity Customer requirements Potential new customers Market information (volumes, customer and competitor pro- files, own market position products) Customer require- ments Business ideas Product and technology road-maps IP/core roadmap Milestone decisions Demand for cooperation Overview of customer satis- faction and development; proposals for corrective action Solved customer problems Enabling Effectiveness and Efficiency 9
SIPOC Diagram Macro level of end-to-end process A goods out process B transport C goods in process Transit Production Pick from stock Put away to stock DC Stock Transport material Ship material Receive material Finished goods stock T0 T1 T2 T3 T4 t4 t1 t2 t3 TT = Transit Time Enabling Effectiveness and Efficiency 10
Process Flow Diagram Example (Page1/2) CPQC escalates the quote to Regional Marketing Start Customer info Part No. Qty Cost Confirmation by NXP Sales / Marketing (Asia) Disti sends special buy request via email Regional Marketing reviews quote CPQC checks special buy price list to determine new request or changed request & document in remarks field (Asia) Regional Marketing escalates to BL Marketing Cost > regional min. price Agreed to price? Yes No CPQC create special buy quote in Model N BL Marketing reviews the quote No Yes No B Regional Marketing modifies the price (resale price / cost) Pursue Business? BL Marketing sets No Bid Regional Marketing release the price Agreed to price? No No Pursue Business Yes CPQC check price curve No Yes Yes Cost > min. field price? BL Marketing modifies & releases the price Regional Marketing sets No Bid BL Marketing releases the price Yes CPQC releases the quote A Enabling Effectiveness and Efficiency 11
Process Flow Diagram Example (Page2/2) Enabling Effectiveness and Efficiency 12
Swim-Lane Flow Chart Enabling Effectiveness and Efficiency 13
Process Flow Diagram with RACI Matrix Enabling Effectiveness and Efficiency 14
Value Stream Map Enabling Effectiveness and Efficiency 15
Value Stream Map applied to Transactional Process Asia Disti Quote Process Value Stream Map Pricing & Quoting Office Average new incoming quote request per day = 240 Takt time = 2 min Model N Model N Model N, by email Model N Disti Disti (26%) 15% 32 CPQC RM / CM Approval 25% BL Mktg Approval 43% 5 184 106 PT=10.9 min PT= 5 min PT= 5 min Total work time = 10.9 * 5 = 54.5 min 1 shift = 8 hrs 57% (14%) 60% 368 min 212 min 64 min NVA=644 min 54.5 min 5 min 5 min VA=64.5 min Enabling Effectiveness and Efficiency 16
Common Pitfalls in Process Mapping Not defining the start and end of the process clearly Confusing the use of operation block and decision block Poor discipline in using a consistent convention Criss-cross of process flow arrows leading to confusion Mapping without involving the right stakeholders Failure to perform a process walkthrough to verify the accuracy of the process mapped Failure to update the process map document as a live reference Enabling Effectiveness and Efficiency 17
How to leverage on Business Process Mapping in your transformation /process improvement initiative? Use the process map to identify the value-added and non-value-added activities. Collect and document the data on process parameters e.g. process cycle-time, pass-through rate and waiting time. Identify opportunities for improvement based on ECRS framework Enabling Effectiveness and Efficiency 18
Process Analysis Example: Current Inbound Process Flow Start Hand over Delivery Order doc to data entry Forwarder register with security Verify Delivery Order Perform weight check Move to BreakBulk Area Perform physical check Data entry key into EKO -DN No. Carton No. Remove the product box from shipping carton Place the product box by lots on trolley / pallet Document on DN the trolly/pallet # & storage type Cutting the carton cover Match the product box against DN Open the carton System assign bin location & correlate with GIT file Data entry will key into SAP: DN #, lot #, trolley/pallet # & storage type Data entry perform posting to SAP (F8 key) Sort location slips by trolley / pallet # Location slip print out Hand over DN to data entry Put the physical product box to assigned bin Match location slip with physical product box Match the trolley / pallet with location sips Move trolley / pallet to inbound staging area Perform closing of transfer order Move to storage location Type 1 NVA Type 2 NVA End Enabling Effectiveness and Efficiency 19
Process Analysis Example: New Inbound Process Flow Start Perform Physical Check & EKO Scan Lay out material acc. to AWB in BB & Sorting Area Forwarder register with security Verify Delivery Order Perform Weight Check Retrieve DN & Open the carton Perform GR by barcode scan of DN#, Trolley & Storage Code. Enter Lot# manually Send material on trolley to binning location Sort Material onto Trolley by DN Print location slip & place on trolley Perform TO closing End Type 1 NVA Enabling Effectiveness and Efficiency 20
Approach to Streamline the Process Enabling Effectiveness and Efficiency 21
ECRS Framework for Process Streamlining Eliminate Remove redundant or non-value-added step Integrate the process step with the next Perform the process step in parallel with another Combine Re- Change the sequence of the process steps Arrange Maintain the process step but simplify the work content Simplify Enabling Effectiveness and Efficiency 22
Sometimes Parallel Processing Does Not Work! Enabling Effectiveness and Efficiency 23
Conclusion Process mapping is an essential tool to understand the current state of the process (As-Is) and to design the future state of the process (To-Be). Disciplined use of process mapping will facilitate the identification and resolution of process issues. Enabling Effectiveness and Efficiency 24