Census 2021 Demography and Migration Overview for Cambridgeshire and Peterborough
This overview highlights key data from the Census 2021 regarding demography and migration in Cambridgeshire and Peterborough. It includes insights on population by age, household populations, average household sizes, country of birth, and length of residence in the UK. The report aims to understand the impact of Covid-19 on the Census results for the region.

Download Presentation

Please find below an Image/Link to download the presentation.
The content on the website is provided AS IS for your information and personal use only. It may not be sold, licensed, or shared on other websites without obtaining consent from the author. Download presentation by click this link. If you encounter any issues during the download, it is possible that the publisher has removed the file from their server.
E N D
Presentation Transcript
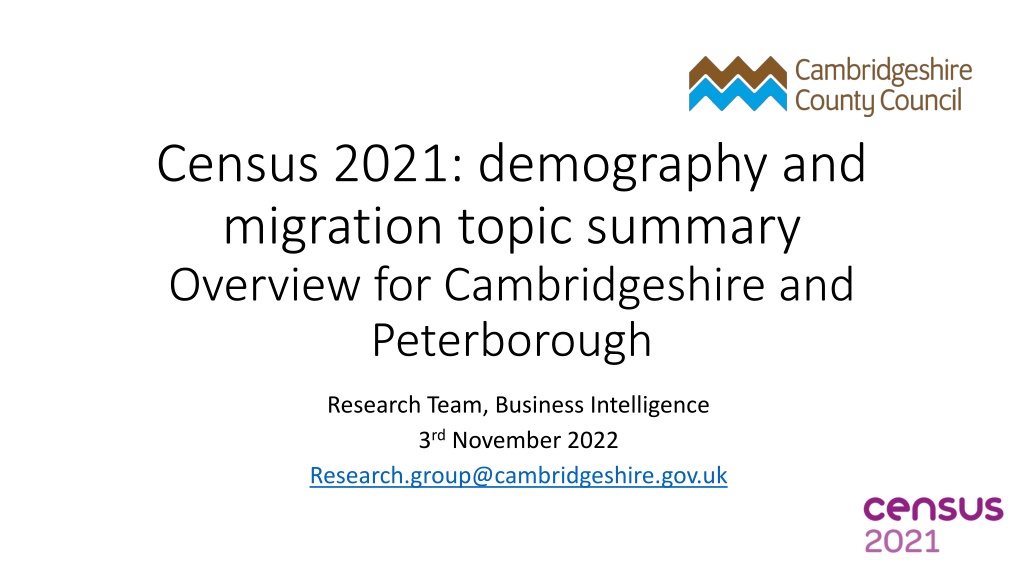
Census 2021: demography and migration topic summary Overview for Cambridgeshire and Peterborough Research Team, Business Intelligence 3rdNovember 2022 Research.group@cambridgeshire.gov.uk
Themes covered A first overview of some of the local authority level Cambridgeshire and Peterborough data from the Demography and Migration topic summary published by the Office for National Statistics (ONS) By local authority: Usual resident population by single year of age Occupied household and communal establishment populations Average household sizes Usual resident population by country of birth Length of residence in UK The release of data helps us to begin to understand any potential impacts of Covid-19 on the Census 2021 results for Cambridgeshire and Peterborough
Definitions Usual resident population Anyone in the UK and had stayed or intended to stay in the UK for a period of 12 months or more; or Had a permanent UK address and was outside the UK and intended to be outside the UK for less than 12 months. Occupied households One person living alone; or A group of people (not necessarily related) living at the same address, who share cooking facilities and share a living room or sitting room or dining area Must contain at least one usual resident Communal establishment population Usual residents living in establishments which provide managed residential accommodation, such as care homes, student halls of residence
Overview: total usual resident population by age The size of the very young population (0-3 years) is smaller at Census 2021 than at Census 2011 for Cambridgeshire and Peterborough The Census 2021 school aged population (4-15 years) is much larger than at Census 2011 for all districts: Ranging from an increase of 2.7% (Huntingdonshire) to 13.4% (South Cambridgeshire) in the more rural districts In Cambridge the school aged population is 27.9% larger and in Peterborough 32.4% larger In the rural districts, the over 65 years population has grown a lot more than the working age population Working age population (16-64 years) has increased by 0.1% (East Cambridgeshire) to 4.1% (South Cambridgeshire) 65 years and over populations have increased by at least 21.1% (Fenland) Cambridge and Peterborough: Population growth since Census 2011 is more evenly spread across all age groups Working age populations (16-64 years) have increased by 18.3% and 14.5% respectively
Overview: household populations and average household sizes The size of the population living in households has increased across all local authorities in Cambridgeshire and Peterborough compared to Census 2011 Census 2021 average household sizes: for England are unchanged compared to Census 2011, have reduced in the more rural local authorities of Cambridgeshire, have increased in the urban centres of Cambridge and Peterborough (where populations compared to Census 2011 are significantly higher)
Overview: average household sizes District Census 2011 household population Census 2011 number of households Census 2011 average household size (number of residents per household) Census 2021 household population Census 2021 number of households Census 2021 average household size (number of residents per household) Change in average household size, Census 2011 to Census 2021 Cambridge 107,345 46,714 2.30 126,382 52,472 2.41 0.11 East Cambridgeshire 83,056 34,614 2.40 87,000 37,203 2.34 -0.06 Fenland 93,934 40,620 2.31 101,057 44,083 2.29 -0.02 Huntingdonshire 166,952 69,333 2.41 178,376 76,880 2.32 -0.09 South Cambridgeshire 146,779 59,960 2.45 160,792 66,996 2.40 -0.05 Cambridgeshire 598,066 181,827 251,241 74,023 2.38 2.46 653,607 277,634 2.35 -0.03 Peterborough 213,464 84,533 2.53 0.07
Overview: household size by number of occupants Numbers of households with one occupant have increased in all districts, and notably in East Cambridgeshire, Huntingdonshire and South Cambridgeshire In Cambridge the increase is much smaller In Cambridge, Huntingdonshire and South Cambridgeshire there have been notable rises in the number of households with 2 and 3 occupants There has been an increase in the number of households with 5 or more occupants in Peterborough, and to a lesser extent in Cambridge
Overview: communal establishment populations Overall the proportions of the population living in households and those living in communal establishments are little changed from Census 2011 across the districts Apart from Cambridge and South Cambridgeshire there have only been small changes in numbers living in communal establishments Cambridge - increased by almost 3 thousand South Cambridgeshire - fell by 650 There is no further breakdown by communal establishment type yet, but these changes are likely to be related to student populations
Overview: population by country of birth International migration has continued to shape the populations of Cambridgeshire and Peterborough Numbers of usual residents born outside the UK have increased by 7.6% to 8.6% in Cambridge and Peterborough In Cambridge population born outside the UK represents 38.0% of the total population compared to 29.4% at Census 2011 In Peterborough population born outside the UK represents 28.2% of the total population compared to 20.6% at Census 2011 In other Cambridgeshire districts the numbers of usual residents born outside the UK have increased by 2.0% to 5.0% Data on length of residence suggests that international in-migration to Cambridge has continued to be high in the last 2 years
Overview: top 5 countries of birth by local authority Top 5 countries of birth by number of residents, excluding UK East South Cambridge Cambridgeshire Fenland Huntingdonshire Cambridgeshire Peterborough India Poland Lithuania Poland India Poland China United States Poland United States Poland Lithuania United States Romania Romania Romania United States Pakistan Italy Germany Germany Germany South Africa India Poland South Africa Portugal India Germany Romania
Cambridge: population by single year of age
Cambridge: percentage change in population Census 2011 to 2021 by age
Cambridge: per cent of population by residence type
Cambridge: net change in households by size, 2011 to 2021
Cambridge: per cent of population by country of birth
Cambridge: population by country of birth, non UK
Cambridge: length of residence in UK
East Cambridgeshire: population by single year of age
East Cambridgeshire: percentage change in population Census 2011 to 2021 by age
East Cambridgeshire: per cent of population by residence type
East Cambridgeshire: net change in households by size, 2011 to 2021
East Cambridgeshire: per cent of population by country of birth
East Cambridgeshire: population by country of birth, non UK
East Cambridgeshire: length of residence in UK
Fenland: population by single year of age
Fenland: percentage change in population Census 2011 to 2021 by age
Fenland: per cent of populations by residence type
Fenland: net change in households by size, 2011 to 2021
Fenland: per cent of population by country of birth
Fenland: population by country of birth, non UK
Huntingdonshire: population by single year of age
Huntingdonshire: percentage change in population Census 2011 to 2021 by age
Huntingdonshire: per cent of population by residence type
Huntingdonshire: net change in households by size, 2011 to 2021
Huntingdonshire: per cent of population by country of birth
Huntingdonshire: population by country of birth, non UK
Huntingdonshire: length of residence in UK
South Cambridgeshire: population by single year of age
South Cambridgeshire: percentage change in population Census 2011 to 2021 by age
South Cambridgeshire: per cent of population by residence type
South Cambridgeshire: net change in households by size, 2011 to 2021
South Cambridgeshire: per cent of population by country of birth
South Cambridgeshire: population by country of birth, non UK
South Cambridgeshire: length of residence in UK