Children and Young People Mental Health Data Pack 2019 in Cambridgeshire and Peterborough
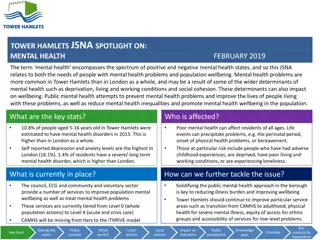
Nearly 34,000 children and young people in Cambridgeshire and Peterborough have a mental health disorder. Self-esteem is higher in girls, especially in Peterborough Year 10 girls. Worries include careers, school, relationships, and appearance. Factors like poverty, child protection plans, and social media affect mental health. Self-harm hospital admission rates are high, with notable trends in different age groups.
Download Presentation

Please find below an Image/Link to download the presentation.
The content on the website is provided AS IS for your information and personal use only. It may not be sold, licensed, or shared on other websites without obtaining consent from the author.If you encounter any issues during the download, it is possible that the publisher has removed the file from their server.
You are allowed to download the files provided on this website for personal or commercial use, subject to the condition that they are used lawfully. All files are the property of their respective owners.
The content on the website is provided AS IS for your information and personal use only. It may not be sold, licensed, or shared on other websites without obtaining consent from the author.
E N D
Presentation Transcript
Cambridgeshire and Peterborough Children and young people (0-25 years) Mental health strategy Data pack 2019
Children and young peoples mental health Summary 1 It is estimated that there are almost 34,000 children and young people aged 2 to 25 years with a diagnosable mental health disorder across Cambridgeshire and Peterborough: Low to medium self-esteem is higher in girls than boys, with levels similar between Year 8 and Year 10 pupils, with the exception of Peterborough Year 10 girls where the proportion is notably higher than Year 8 girls. Girls have higher levels of low resilience compared to boys, with a notable increase between Year 8 and Year 10 girls. Overall Peterborough s Year 10 girls reported having lower levels of self-esteem and resilience compared to Cambridgeshire s. Again Peterborough Year 10 girls reported notably high low life satisfaction. 1,800 pre-school children 6,500 primary school children 8,700 secondary school children 5,200 young people aged 17 to 19 years 11,700 young adults aged 20 to 25 years The top worries that pupils reported were about their careers, schools work, relationships with friends and parents/carers, as well as their parents/carer relationships, their health and the way they look. Prevalence increases with age, most notably in emotional disorders. It is forecast that mental disorders in 5 to 19 year olds will increase by 10% in both Cambridgeshire and Peterborough between 2019 and 2024, followed by 5% to 2029. It is important to note that this reflects forecast population changes only. There are other factors that are known to influence a child or young person mental health: Fenland and Peterborough have statistically significantly high proportions of children living in poverty. Public Health England estimate that prevalence is likely to be higher in Fenland and Peterborough compared to the national estimate, based on age, sex and socio-economic factors. In 2018 there were 705 children care in Cambridgeshire and 370 in Peterborough, with rates statistically significantly higher in Peterborough compared to England. Peterborough has statistically significantly high rates of child protection plans due to neglect, looked after children due to abuse or neglect, children in need due to abuse or neglect and repeat child protection cases compared to England. Cambridgeshire has statistically significantly high children in need due to abuse or neglect and repeat child protection cases compared to England. Significant factors that are associated with mental disorders in children and young people include boys, white ethnic groups, poor parental mental health, low income and disability benefits, unhealthy family functioning, no parental qualifications, lone parents, stepchildren and stepsiblings in the household and living in social rented accommodation. Where data exist for these indicators Fenland and Peterborough show as having the highest number of significant risk factors. In 2018 there were 81 unaccompanied asylum seeking looked after children in Cambridgeshire and Peterborough, a lower number than in 2017. In term of social context children who spend longer on social media, who have been bullied or are bullies, have low levels of social support, have self-harmed or attempted suicide in the past four weeks, not participated in clubs or organisations outside of school, have tried alcohol, illicit drugs, tobacco and e-cigarettes and not identified as heterosexual are more likely to have a mental disorders compared to those without. Local data relating to these indicators are available from the Health Related Behaviour Survey (HRBS) for Cambridgeshire and Peterborough. The responses are fairly similar between the areas, with higher reporting of bullying related issues and lower alcohol usage in Peterborough. It is important to note that not all secondary schools completed the survey. Cambridgeshire and Peterborough have statistically significantly high self-harm hospital admission rates in children and young people aged 10 to 24 years, with overall increasing trends. Peterborough is experiencing a downward trend in admissions in 20 to 24 year olds and both areas have static trends in 10 to 14 year olds, although there was a notable increase in this age band between 2016/17 and 2017/18. Self poisoning is the main reason for admission. Family homelessness is statistically significantly high in Peterborough, with over treble the national rate. The HRBS also asks pupils questions around self-esteem, resilience and life satisfaction.
Children and young peoples mental health - summary Summary 2 Both Cambridgeshire and Peterborough have statistically significantly lower or statistically similar proportions of children with special educational needs (SEN) in primary and secondary pupils compared to England. At the time of the 2011 Census Peterborough had a statistically significantly high proportion of dependent children living in households where no adult was in employment, and Cambridgeshire a statistically significantly low proportion. There are downward trends in the rate of first time entrants to the youth justice system, with rates statistically significantly better than England in Cambridgeshire and statistically similar in Peterborough. Cambridgeshire and Peterborough generally have low levels of SEN pupils with social, emotional and mental health needs compared to England. Perinatal mental health prevalence estimates suggest that 310 women in Cambridgeshire and Peterborough have severe depressive illnesses during the perinatal period, as well as 25 having a chronic serious illness and the same number having postpartum psychosis. In terms of risk factors Peterborough has statistically significantly high proportions or rates of sole registered births, births to non UK parents, births to under 20 year olds, children living in poverty, child protection plans, children in need, lone parent families and statutory homelessness compared to England. It is estimated that 12,300 children aged 0 to 5 years in Cambridgeshire and 5,200 in Peterborough live with parents where there has been domestic violence and abuse. In terms of risk taking lifestyle behaviours such as smoking, drinking and drug taking these tend to increase with age, with Peterborough generally having poorer lifestyle behaviours than Cambridgeshire. Peterborough has statistically significantly high proportions of severely obese Reception pupils and overall excess weight in Year 6 pupils. Educational attainment is seen as a protective factor for mental health. Good levels of development at the end of Reception are statistically significantly lower in Cambridge, Fenland and Peterborough than experienced nationally. In 2017/18 Fenland, Huntingdonshire and Peterborough had statistically significantly low levels of GCSE attainment compared to the national average. Attainment in children in care is notably lower than the overall attainment scores. Pupil absence is statistically significantly high in Fenland compared to the national average. Notes Children and young people population for reference Mental disorder definitions Age group Cambridgeshire Peterborough Total Emotional disorders include anxiety disorders, depressive disorders and mania and bipolar affective disorder. 23,400 9,500 33,000 2 to 4 year olds Behavioural (or conduct) disorders are a group of disorders characterised by repetitive and persistent patterns of disruptive and violent behaviour in which the rights of others, and social norms or rules, are violated. 48,900 18,900 67,800 5 to 10 year olds 44,900 15,800 60,700 11 to 16 year olds 23,800 7,000 30,800 17 to 19 year olds Hyperactivity disorders include disorders characterised by inattention, impulsivity, and hyperactivity. 55,400 14,900 70,300 20 to 25 year olds Other less common disorders include autism spectrum disorders (ASD), eating disorders, tic disorders, and a number of very low prevalence conditions. 196,500 66,100 262,600 Total Source: 2019 population based on mid 2015 population forecasts, Research Group, Business Intelligence, Cambridgeshire County Council
Children and Young people mental health prevalence and forecasts Identification of need Estimated number of children and young people with a diagnosed mental disorder, 2019 Forecasts Age group Prevalence Cambridgeshire Peterborough Total In both Cambridgeshire and Peterborough Estimated that almost 34,000 children and young people aged 2 to 25 have a mental disorder in Cambridgeshire and Peterborough 2 to 4 year olds 5.5% 1,300 500 1,800 10%increase between 2019 and 2024 5% increase between 2024 and 2029 5 to 10 year olds 9.5% 4,600 1,800 6,400 11 to 16 year olds 14.4% 6,500 2,300 8,700 17 to 19 year olds 16.9% 4,000 1,200 5,200 20 to 25 year olds 16.7% 9,200 2,500 11,700 Total 25,700 8,300 33,900 National prevalence by age group Prevalence increases with age Emotionaldisorders are highest in 17 to 19 year olds Behavioural disorders are highest in 11 to 16 year olds Source: Mental Health of Children and Young People in England, 2017 and Adult Psychiatric Morbidity Survey in England, 2014, NHS Digital, Applied to Mid 2015 population forecasts, Research Group, Business Intelligence, Cambridgeshire County Council
Children and Young people mental health prevalence Identification of need Preschool children aged 2 to 4 years Primary school children aged 5 to 10 years Any Emotional disorders Behavioural disorders Hyperactivity disorders Any less common disorder 2.8% 120 Any Emotional disorders Behavioural disorders Hyperactivity disorders Any less common disorder 2.2% 190 Estimated number Estimated number disorder disorder Prevalence 5.5% 230 1.0% 40 2.5% 110 0.5% 20 9.5% 840 4.1% 360 5.0% 440 1.7% 150 Prevalence Cambridge City Cambridge City East Cambridgeshire 660 280 350 120 150 East Cambridgeshire 180 30 80 20 90 Fenland 680 290 360 120 160 Fenland 190 40 90 20 100 Huntingdonshire 1260 540 660 230 290 Huntingdonshire 360 70 160 30 180 South Cambridgeshire 1,210 520 640 220 280 South Cambridgeshire 320 60 150 30 160 Cambridgeshire 4,650 2,010 2,450 830 1,080 Cambridgeshire 1,290 230 590 120 660 Peterborough 1,800 780 950 320 420 Peterborough 520 100 240 50 270 Total 6,450 2,780 3,390 1,150 1,490 Total 1,810 330 820 160 920 Secondary school children aged 11 to 16 years Young adults aged 17 to 19 years Any Emotional disorders Behavioural disorders Hyperactivity disorders Any less common disorder 2.2% 160 Any Emotional disorders Behavioural disorders Hyperactivity disorders Any less common disorder 1.8% 140 Estimated number Estimated number disorder disorder Prevalence Prevalence 14.4% 1,070 9.0% 670 6.2% 460 2.0% 150 16.9% 1,360 14.9% 1,200 0.8% 60 0.8% 60 Cambridge City Cambridge City East Cambridgeshire 920 570 400 130 140 East Cambridgeshire 400 350 20 20 40 Fenland 950 590 410 130 150 Fenland 530 470 30 30 60 Huntingdonshire 1,780 1,110 770 250 270 Huntingdonshire 920 810 40 40 100 South Cambridgeshire 1,750 1,090 750 240 270 South Cambridgeshire 820 720 40 40 90 Cambridgeshire 6,460 4,040 2,780 900 990 Cambridgeshire 4030 3,550 190 190 430 Peterborough 2,270 1,420 980 320 350 Peterborough 1,180 1,040 60 60 130 Total 8,730 5,460 3,760 1,210 1,330 Total 5,210 4,590 250 250 550 PHE adjusted estimate 5 to 16 years * Cambridge East Cambs Fenland Huntingdonshire South Cambs Cambridgeshire Peterborough Total England 8.1% 8.3% 9.9% 8.5% 7.5% 8.4% 9.8% 8.7% 9.2% Source: Mental Health of Children and Young People in England, 2017 and Adult Psychiatric Morbidity Survey in England, 2014, NHS Digital, Applied to Mid 2015 population forecasts, Research Group, Business Intelligence, Cambridgeshire County Council. * adjusted national prevalence estimates based on age, sex and socio-economic classification
Children and young peoples mental health Identification of need Factors that are associated with mental disorders * Preschoolchildren Primary schools Secondary schools Boys Boys White ethnic group White ethnic group White ethnic group Unhealthy family functioning ** Parental poor mental health *** Unhealthy family functioning ** Poor parental mental health *** In receipt of benefits (low-income and disability) Poor parental mental health *** Lone parent - single No parental qualifications In receipt of benefits (low-income and disability) Lone parent previously married In receipt of benefits (low income and disability) Either/both stepchildren and stepsiblings in household Living in social rented accommodation Local picture Cambridge East Fenland Huntingdonshire South Cambridgeshire Peterborough England Cambridgeshire Cambridgeshire White pupils 1 68.8% 91.4% 93.9% 88.6% 85.3% 85.8% 68.7% 73.3% Children in low income families (under 20) 2 14.1% 9.1% 18.0% 10.4% 7.9% 11.4% 18.7% 17.0% No qualifications 3 5.2% 5.3% 9.6% 4.8% 3.2% 5.2% 10.3% 7.3% Lone parent families 3 21.9% 16.9% 27.4% 20.7% 16.0% 20.1% 29.8% 28.7% Step children in family 3 6.0% 8.4% 11.0% 9.5% 6.8% 8.3% 8.8% 8.0% Social rented accommodation 3 31.3% 16.8% 15.5% 15.9% 14.6% 18.0% 21.2% 21.3% Almost all districts in Cambridgeshire have statistically significantly high proportions of White populations. Fenland and Peterborough have the highest number of statistically significantly high risk factors. Source: Mental Health of Children and Young People in England, 2017 ** based on McCaster Family Assessment Device (FAD) *** based on GHQ-12 scores * based on odd ratios to determine the likelihood of a mental disorder occurring relative to the reference category, whilst controlling for other factors e.g. the odds of a boy having a mental disorder compared to girls is statistically higher 1 Pupil characteristics, School Census 2019, DfE 2 2016 Public Health Outcomes Framework, Fingertips, PHE 3 Census 2011, based on dependent children in families, ONS (definitions used from https://cambridgeshireinsight.org.uk/wp- content/uploads/2017/08/Children-and-Young-People-Report-2011-Census.pdf)
Children and young peoples mental health - social context Identification of need Young people with a mental disorder were more likely than those without to have: Health Related Behaviour Survey responses Cambridgeshire Peterborough Spent longer (four hours or more) on social media, compared themselves to others when online, and felt that the number of likes they got affected their mood 55% of Year 8 and 69% of Year 10 pupils spent at least 3 hours using the internet the day before the survey, mainly social networking 54% of Year 8 and 69% of Year 10 pupils spent at least 3 hours using the internet the day before the survey, mainly social networking Been bullied and bullied others, both online and offline 6% of pupils responded that they often or very often feel afraid of going to school because of bullying. 12% of boys and 22% of girls reported being worried about being bullied quite a lot or a lot 9% of pupils responded that they often or very often feel afraid of going to school because of bullying. 16% of boys and 27% of girls reported being worried about being bullied quite a lot or a lot 3% of pupils responded that they think others may fear going to school because of them 4% of pupils responded that they think others may fear going to school because of them Low levels of social support and a smaller social network No local data Self-harmed or attempted suicide both in he past four weeks and at some point in their life Statistically significantly high self-harm hospital admission rate in children and young people compared to England * Statistically significantly high self-harm hospital admission rate in children and young people compared to England * Not participated in clubs or organisations, in or out of school No local data Tried alcohol, illicit drugs, tobacco and e-cigarettes 25% of pupils reported that they had had an alcoholic drink in the 7 days before the survey. Hospital alcohol admission rates in under 18 year olds are statistically similar to England, with an overall increasing trend since 2012/15 * 23% of pupils reported that they had had an alcoholic drink in the 7 days before the survey. Hospital alcohol admission rates in under 18 year olds are statistically better than England, with an overall decreasing * 5% of pupils responded that they have taken at least one illicit drug in the last month 5% of pupils responded that they have taken at least one illicit drug in the last month 14% of pupils smoked in the past or smoke now, with 3% regularly smoking. 17% responded that they had tried vaping 14% of pupils smoked in the past or smoke now, with 3% regularly smoking. 19% responded that they had tried vaping Not identified as heterosexual 84% of pupils responded that they are straight/heterosexual 84% of pupils responded that they are straight/heterosexual Source: Mental Health of Children and Young People in England, 2017, NHS Digital. Local data from Health Related Behaviour Survey, 2018, Schools Health Education Unit * Public Health Outcomes Framework, Fingertips, PHE
Children and Young people self-esteem, resilience and worries Identification of need Emotional health and well-being Medium/low self-esteem Worries Low resilience Low life satisfaction Top worries quite a lot or a lot Boys Girls Year 8 Year 10 Year 8 Year 10 Year 8 Year 10 Cambridgeshire Cambridgeshire Boys 19% 18% 23% 25% 5% 5% Their career 43% School-work/exams/tests 67% Girls 35% 38% 36% 44% 8% 8% School-work/exams/tests 38% The way they look 61% Peterborough Boys 23% 26% 25% 25% 6% 4% Relationships with friends 37% Relationships with friends 55% Girls 37% 48% 38% 54% 7% 15% Relationships between parents/carers in their family 35% Their career 49% Levels of self esteem and resilience are lower in girls than boys, and decrease with age Relationships between parents/carers in their family Their health 29% 43% Peterborough Year 10 girls in Peterborough had the highest levels of low life satisfaction Their career 52% School-work/exams/tests 65% Relationships between parents/carers in their family 50% The way they look 59% Relationships with friends 43% Their career 57% Relationships between children and parents/carers in the family 40% Relationships with friends 53% Relationships between parents/carers in the family Their health 39% 49% Source: Health Related Behaviour Survey, 2018, School Health Education Unit
Social Care Primary prevention: adversity Child protection plans, looked after children and children in need, 2018 Child protection plan with initial category of : Repeat child protection cases Started to be looked after due to: Children in need due to: Abuse Neglect Abuse or neglect Family stress, dysfunction or absent parenting Abuse or neglect Family stress, dysfunction or absent parenting Parent disability or illness Number Rate per 10,000 Number Rate per 10,000 Number % Number Rate per 10,000 Number Rate per 10,000 Number Rate per 10,000 Number Rate per 10,000 Number Rate per 10,000 Cambridgeshire 201 14.9 275 20.4 148 24.3 232 17.2 82 6.1 2,619 194.7 266 19.8 45 3.3 Peterborough 84 16.8 144 28.8 96 27.8 142 28.4 22 4.5* 1,282 256.4 243 49.6 15 3.0 England 25,160 21.2 25,820 21.8 13,900 20.2 19,420 16.4 10,950 9.3 215,270 181.4 110,530 93.8 10,490 8.8 Cambridgeshire has statistically significantly high rates compared to England of: children in need due to abuse or neglect repeat child protection cases Peterborough has statistically significantly high rates compared to England of: child protection plans due to neglect looked after children due to abuse or neglect children in need due to abuse or neglect repeat child protection cases In 2018 there were 705 children in care in Cambridgeshire and 370 in Peterborough, with rates in Peterborough statistically significantly higher than England Unaccompanied Asylum Seeking Children looked after, 2018: Average difficulties score for all looked after children aged 5 to 16 years who have been in care for at least 12 months on 31 March 2018 Mean - score Area Cambridgeshire Peterborough 62 children 19 children Cambridgeshire Peterborough England 14.9 14.1 14.2 Both areas experienced lower numbers than in 2017 Source: Children and Young People s Mental Health and Wellbeing profile, Fingertips, Public Health England * value excludes contributions from areas with suppressed values
Educational attainment A School readiness good level of development at the end of Reception, 2017/18C GCSE Attainment 8, 2017/18 Protective factors Fenland, Huntingdonshire and Peterborough have statistically significantly low Attainment 8 scores compared to England 95% Confidence Intervals Area Mean Score Cambridge 52.3 (50.6 - 54.0) East Cambridgeshire Fenland Huntingdonshire South Cambridgeshire Cambridgeshire Peterborough England 48.2 40.9 45.6 53.3 48.1 42.3 46.7 (46.8 - 49.6) (39.7 - 42.1) (44.6 - 46.6) (52.3 - 54.3) (47.6 - 48.6) (41.5 - 43.1) (46.6 - 46.8) C Attainment 8, Children in care, 2017/18 Good level of development at the end of Reception is statistically significantly lower in Cambridge City, Fenland and Peterborough than experienced nationally The average GCSE attainment scores for children in care are notably lower than the total Population. The average score is higher in Peterborough than Cambridgeshire Area Mean Score Cambridgeshire Peterborough England 17.9 19.6 19.3 B Not in education, employment or training (NEET), 16-17 year olds, 2017 Area Number (%) D Pupil absence, 2017/18 95% Percentage (%) Peterborough has a statistically significantly high NEET proportion compared to England Pupil absence is statistically significantly high in Fenland compared to England Percentage 95% Confidence Intervals Area Number Confidence Intervals (4.56 - 5.33) (4.07 - 4.83) (4.88 - 5.68) (4.10 - 4.66) (3.95 - 4.50) (4.41 - 4.71) (4.62 - 5.08) (4.52 - 4.77) (4.80 - 4.83) Trend Cambridge East Cambridgeshire Fenland Huntingdonshire South Cambridgeshire Cambridgeshire Peterborough Cambridgeshire and Peterborough England 210,466 180,996 211,561 313,445 510,460 1,229,927 548,926 1,778,853 118,236,069 4.93 4.44 5.27 4.37 4.22 4.56 4.84 4.64 4.81 Cambridgeshire Peterborough Cambridgeshire and Peterborough England 390 320 710 68,070 3.2 7.0 4.2 6.0 (2.9 - 3.5) (6.3 - 7.8) (3.9 - 4.5) (6.0 - 6.0) Source: A Cambridgeshire, Peterborough and England from Early Years Foundation Stage Profile, 2017/18, Department for Education B & D Public Health Outcomes Framework, Fingertips, PHE C Child and Maternal Health Profile, Fingertips, PHE
Special Educational Needs (SEN) Primary prevention: Vulnerability School pupils with social, emotional and mental health needs, 2018 15.5 In 2018 15.0 Primary school age Secondary school age 13.3% (6,904) Cambridgeshire 14.5 Primary schools 14.0 Number % Number % 13.7% (2,845) Peterborough 13.5 #N/A Cambridgeshire 1,097 2.12 569 1.78 13.0 Primary school children were identified as having SEN 12.5 Peterborough 335 1.61 254 1.64 12.0 Cambridgeshire Peterborough Cambridgeshire and Peterborough England England 103,326 2.19 75,431 2.31 11.5 2016 2017 2018 13.5 In 2018 Cambridgeshire and Peterborough have statistically significantly low proportions of SEN pupils with social, emotional and mental health needs in Secondary School pupils compared to England. 13.0 Secondary schools 11.2% (3,604) Cambridgeshire 12.5 Percentage (%) 12.0 11.1% (1,718) Peterborough 11.5 Secondary school children were identified as having SEN 11.0 10.5 Cambridgeshire Peterborough Cambridgeshire and Peterborough England 10.0 2016 2017 2018 Source: Children and Young People s Mental Health and Wellbeing profile, Fingertips, Public Health England
Children in Poverty A District Primary prevention: adversity B Income deprivation affecting children (%) % of children Trend Fenland and Peterborough havestatistically significantly high proportions of children living in poverty Cambridge City 13.7% East Cambridgeshire 8.6% Fenland 18.4% Huntingdonshire 10.5% South Cambridgeshire 7.6% Cambridgeshire 11.3% Peterborough 18.7% Cambridgeshire and Peterborough 13.5% England 16.8% C Decreasing trend in children living in poverty, especially in Peterborough but remains significantly higher than England Hotspots within Cambridgeshire where children are living in deprived households - visibly higher to the north of the area Source A & C Children (under 16 years) living in poverty Public Health Outcomes Framework, Fingertips, PHE B Income Deprivation Affecting Children Index (IDACI), Department for Communities and Local Government Definition A & C Percentage of children aged under 16 living in families in receipt of Child Tax Credit whose reported income is less than 60 per cent of the median income or in receipt of Income Support or Job Seeker s Allowance, 2015 B Proportion of children aged 0 15 years living in income deprived households as a proportion of all children aged 0 15 years. LSOA level deprivation data are applied proportionally to practice populations, 2015
Self-harm hospital admissions 10 to 24 year olds Identification of need Local analysis for 2017/18: Area 10 to 24 year olds 10 to 14 year olds 15 to 19 year olds 20 to 24 year olds In 2017/18 there were 777 hospital admissions for self- harm in 10 to 24 year olds in Cambridgeshire and 197 in Peterborough, with both areas having statistically significantly high rates compared to England. 2017/18 Rates Number 777 197 - Rate 662.7 587.2 116.9 Trend Number 102 42 Rate 282.9 347.7 35.3 Trend Number 387 110 Rate 1039.0 1015.0 170.1 Trend Number 288 45 Rate 666.0 414.5 75.8 Trend Cambridgeshire Peterborough England East Cambridgeshire and South Cambridgeshire had statistically significantly high rates compared to the overall Cambridgeshire and Peterborough rate, with Huntingdonshire having a statistically significantly low rate in comparison. There has been a noticeable increase in East Cambridgeshire, which appears to be due to a small number of patients being admitted numerous times during the year. 10 to 24 year olds Cambridgeshire Peterborough Between 2016/17 and 2017/18 increases were seen in 10 to 19 year olds in both Cambridgeshire and Peterborough and in 20 to 24 year olds in Cambridgeshire. Rates continue to decrease in 20 to 24 year olds in Peterborough. Trend Overall trends are increasing but there is a decreasing trend in 20 to 24 year olds in Peterborough and static trends in both areas in 10 to 14 year olds. There appears to be a correlation between self-harm emergency hospital admissions and deprivation in Cambridgeshire with statistically significantly high rates in the fifth most deprived wards in the county compared to the least deprived fifth of wards. In Peterborough there appears to be little correlation to deprivation, with the highest rate seen in the second least deprived quintile, as well as none of the quintile rates differing significantly to the Peterborough rate. Cambridgeshire and Peterborough Emergency hospital admissions for self harm, age specific rates per 100,000 population, 2015/16 - 2017/18 combined Self-poisoning is the main reason for self-harm emergency hospital admissions in children and young people aged 10 to 24 years in both Cambridgeshire and Peterborough, and most notably poisoning by nonopioid analgesics, antipyretics and antirheumatics. 1,800.0 Male Female 1,600.0 Age and sex breakdown 1,400.0 Self-harm admission rates peak in 15 to 19 year olds with rates notably higher in young females than young males. Just over three-quarters of self-harm hospital admissions in Cambridgeshire also had a mental health diagnosis recorded, compare to 56% in Peterborough. Mood [affective] disorders were the main diagnoses seen in this cohort of children and young people. However there has been a notable increase in the number and proportion of admissions with an adult personality disorders in Cambridgeshire. In Peterborough there was an increase in the proportion of mood [affective] disorders, a decrease in the proportion of mental and behavioural disorders due to psychoactive substance use and an increase in the proportion of disorders of adult personality and behaviour between 2016/17 and 2017/18. Numbers are relatively small and therefore prone to fluctuation. 1,200.0 Rate per 100,000 1,000.0 800.0 600.0 400.0 200.0 0.0 10-14 yrs 15-19 yrs 20-24 yrs 25-29 yrs 30-34 yrs 35-39 yrs 40-44 yrs 45-49 yrs 50-54 yrs 55-59 yrs 60-64 yrs 65+ yrs 10-14 yrs 15-19 yrs 20-24 yrs 25-29 yrs 30-34 yrs 35-39 yrs 40-44 yrs 45-49 yrs 50-54 yrs 55-59 yrs 60-64 yrs 65+ yrs Cambridgeshire Peterborough Source: Hospital Episdoe Statistics (HES), NHS Digital - held by Cambridgeshire County Council Source: Public Health Outcomes Framework, Fingertips, Public Health England Source : Hospital Episode Statistics, NHS Digital held by Cambridgeshire County Council
Other Primary prevention: adversity A Family homelessness, 2017/18 B Unemployment Households with dependent children where no adult is employment, 2011 Rate per 1,000 households 95% Confidence Intervals Area Number Trend Cambridgeshire Peterborough England 2.5% statistically significantly lower than England 4.9% statistically significantly higher than England 4.2% Cambridgeshire Peterborough Cambridgeshire and Peterborough England 479 461 940 40,990 1.8 5.8 2.7 1.7 (1.6 - 1.9) (5.2 - 6.3) - (1.7 - 1.8) 7.0 C First time entrants to the youth justice system, 2018 6.0 Rate per 100,000 95% Confidence Intervals Area Number Trend Rate per 1,000 households 5.0 Cambridgeshire Peterborough England 100 32 11,887 175.8 169.4 238.5 (143.0 - 213.8) (115.9 - 239.2) (234.2 - 242.8) 4.0 3.0 Rates are decreasing in both Cambridgeshire and Peterborough 2.0 1.0 Cambridgeshire Peterborough Cambridgeshire and Peterborough England 0.0 2011/12 2012/13 2013/14 2014/15 2015/16 2016/17 2017/18 Family homelessness rates are notably and statistically significantly high in Peterborough compared to England, with overall increasing trends. Source: A Public Health Outcomes Framework, Fingertips, Public Health England B & C Children and young people Mental Health and Wellbeing profiles, Fingertips, Public Health England
Estimated number of children living in households where there is domestic violence, mental ill-health and substance misuse Primary prevention: adversity Moderate severity High severity Adult has .. Prevalence in children aged 0 to 5 years Estimated number of children aged 0 to 5 years Estimated number of children aged 0 to 5 years Adult has .. Prevalence in children aged 0 to 5 years Estimated number of children aged 0 to 5 years Estimated number of children aged 0 to 5 years Cambridgeshire Peterborough Cambridgeshire Peterborough Ever experienced domestic violence and abuse Adult experienced DV&A in the last year 7.1% 3,300 1,400 26.7% 12,300 5,200 Adult has alcohol or drug dependency 4.4% 2,000 900 Reported substance misuse 11.2% 5,200 2,200 Adult has severe mental ill-health symptoms Moderate or higher mental ill-health symptoms 11.5% 5,300 2,200 31.9% 14,700 6,200 Adult has as least 1 issue 16.7% 7,700 3,200 At least 1 issue 45.9% 21,100 8,900 Adult has 2+ issues 5.1% 2,300 1,000 2+ issues 20.0% 9,200 3,900 Adult has DV&A + substance misuse issues 1.3% 600 300 DV&A + substance misuse issues 5.2% 2,400 1,000 Adult has DV&A + mental health issues 4.0% 1,800 800 DV&A + mental health issues 16.6% 7,600 3,200 Adult has DV&A + substance misuse issues or mental health issues DV&A + substance misuse issues or mental health issues 4.0% 1,800 800 17.4% 8,000 3,400 Domestic violence and abuse (DV&A) = ever experienced Parental substance misuse (alcohol or drugs) = engages in Parental mental health issues = moderate or higher symptoms of mental or psychiatric disorders Domestic violence and abuse (DV&A) = within the last year Parental substance misuse = dependent on alcohol or drugs Parental mental health issues = severe symptoms of mental or psychiatric disorders
Healthy lifestyles Primary prevention: Vulnerability Cambridgeshire Peterborough Year 8 Year 10 Total Year 8 Year 10 Total Number of pupils 3,860 3,473 7,333 710 514 1,224 No fruit or vegetables on the day before the survey 7.3% 10.0% 8.6% 10.9% 15.9% 13.0% Nothing to eat or drink before lessons on day of survey 10.3% 12.9% 11.5% 13.9% 20.5% 16.7% Unfit or very unfit 15.8% 21.6% 18.6% 19.4% 26.1% 22.2% Ever smoked 5.9% 22.1% 13.5% 7.2% 21.8% 13.3% Drank alcohol in the 7 days before the survey 15.0% 35.5% 24.7% 13.9% 34.2% 22.3% Ever offered drugs 11.2% 36.8% 23.2% 17.8% 37.3% 25.7% Ever taken drugs 3.5% 16.0% 9.4% 4.5% 18.3% 10.1% 79.7% 71.3% 75.8% 82.8% 58.8% 73.5% Don t know if local contraception advice service In sexual relationship or had sex in the past 2.0% 14.8% 8.0% 3.5% 16.2% 8.3% Experienced at least one negative behaviour * in relationship with a current or previous boyfriend/girlfriend 22.4% 28.1% 25.1% n/a n/a n/a Healthy lifestyle behaviours decrease with age. In general, Peterborough has poorer positive lifestyle behaviours in young people than Cambridgeshire, with the exception of alcohol use. Source: Health Related Behaviour Survey, 2018, Schools Health Education Unit
Healthy lifestyles excess weight Primary prevention: Vulnerability Reception (4-5 year olds) Year 6 (10-11 year olds) Obese Overweight Obese Severely obese Total excess weight Overweight Severely obese Total excess weight (includes severely obese) (includes severely obese) % % % % % % % % Number Number Number Number Number Number Number Number Cambridge 100 9.4% 56 5.2% 11 1.0% 156 14.6% 123 12.6% 129 13.3% 24 2.5% 252 25.9% East Cambridgeshire 76 8.9% 54 6.3% 11 1.3% 130 15.2% 106 11.7% 136 15.0% 21 2.3% 242 26.7% Fenland 135 12.9% 108 10.4% 23 2.2% 243 23.3% 135 14.1% 197 20.6% 42 4.4% 332 34.7% Huntingdonshire 234 12.7% 125 6.8% 28 1.5% 359 19.4% 224 12.8% 258 14.7% 45 2.6% 482 27.5% South Cambridgeshire 182 10.4% 92 5.3% 17 1.0% 274 15.7% 204 11.7% 196 11.2% 29 1.7% 400 22.9% Cambridgeshire 727 11.1% 435 6.6% 90 1.4% 1,162 17.7% 792 12.5% 916 14.5% 161 2.5% 1,708 27.0% Peterborough 331 11.8% 278 9.9% 86 3.1% 609 21.7% 392 14.2% 629 22.7% 140 5.1% 1,021 36.9% England 77,151 12.9% 57,869 9.7% 14,495 2.4% 135,020 22.6% 84,514 14.1 121,409 20.2% 26,158 4.4% 205,923 34.3% Cambridgeshire has statistically significantly lower proportions of overweight and obese children compared to England. Peterborough has statistically similar proportions to England, with the exception of severely obese Reception pupils and overall excess weight in Year 6 pupils. Source: National Child Measurement Programme, 2018/19, NHS Digital
Healthy relationships Primary prevention: Vulnerability Cambridgeshire Peterborough Year 8 Year 10 Total Year 8 Year 10 Total Number of pupils 3,860 3,473 7,333 710 514 1,224 Relationships (with a previous or current boyfriend/girlfriend) Used hurtful or threatening language to me 7.9% 12.5% 10.1% 10.3% 18.3% 13.4% Was angry or jealous when I wanted to spend time with my friends 15.5% 21.2% 18.2% 19.3% 25.8% 21.8% They kept checking my phone 7.1% 11.8% 9.3% 9.2% 16.3% 11.9% Put pressure on me to have sex or do other sexual things 4.1% 8.7% 6.3% 4.8% 10.6% 7.0% Threatened to tell people things about me 6.1% 8.6% 7.3% 7.1% 10.9% 8.5% Threatened to hit me 3.3% 4.6% 3.9% 5.6% 7.0% 6.1% Hit me 3.9% 5.7% 4.8% 7.5% 7.2% 7.4% Sexual relationships Currently in a relationship and thinking about having sex 2.0% 5.2% 3.5% 2.1% 4.7% 3.1% In a sexual relationship or have had sex in the past 2.0% 14.8% 8.0% 3.5% 16.2% 8.3% Taken risks with sex after drinking alcohol or drug use 0.5% 5.0% 2.7% 4.5% 10.4% 9.0% Gone further than would like after drinking alcohol or drug use 2.2% 7.6% 4.8% 2.0% 6.1% 3.6% Negative personal and sexual relationships increase with age, and are generally higher in Peterborough than Cambridgeshire, but numbers are relatively small. Around a fifth of young people has been in a relationship where their boyfriend or girlfriend has been jealous of them wanting to be with their friends. Around 1 in 6 Year 10 pupils have been in a sexual relationship, with some having taken risks after drinking alcohol or drug use. (it is important to note that numbers are very small, especially in Peterborough) Source: Health Related Behaviour Survey, 2018, Schools Health Education Unit
Perinatal mental health Demographics and risk factors Prevalence Estimated number of women CCC PCC CCC and PCC England Time Period Rate per 1,000 maternities Cambridge shire Peterborough General Fertility Rate 2016 58.8 78.4 63.5 62.5 Postpartum psychosis 2 15 10 Demographics Women of childbearing age 2017 18.4% 19.7% 18.7% 19.0% Chronic Serious Mental Illness in perinatal period Birth to non UK parents 2017 35.0% 54.0% 40.9% 34.8% 2 15 10 Births to mothers aged under 20 2017 2.3% 4.3% 2.9% 2.9% Severe depressive illness in perinatal period 30 215 95 Births to mothers aged 40+ 2017 4.8% 2.7% 4.1% 4.4% Lower estimate Sole registered births 2017 3.6% 6.4% 4.5% 5.1% 100 715 310 Mild-moderate depressive illness and anxiety in perinatal period Stillbirth rate 2015/17 3.7 4.1 3.8 4.3 Upper estimate 150 1,075 465 Infant mortality 2015/17 3.3 4.3 3.6 3.9 2017 12.9 22.4 15.2 17.8 Under 18 s conceptions PTSD in perinatal period 30 215 95 Income deprivation affecting children 2015 12.7% 25.1% 15.9% 19.9% Risk and related factors Lower estimate 150 1,075 465 Looked After Children aged under 5 2017/18 26.4 34.9 28.9 34.9 Adjustment disorders and distress in perinatal period Child protection plans aged under 18 2014/15 29.4 49.6 34.7 42.9 Upper estimate 300 2,145 925 Children in need under 18 2017/18 480 841 578 635 Parents in drug treatment 0-15 2011/12 84.2 129.8 96.0 110.4 Identification and access 147.2 Parents in alcohol treatment 0-15 2011/12 77.1 193.4 107.2 CCC PCC CCC and PCC England Lone parent families 2011 4.9% 7.9% 5.6% 7.1% Domestic abuse-related incidents and crimes 2017/18 20.8 20.8 20.8 25.1 New birth visits within 14 days 95.2% 90.4% 93.6% 87.7% Statutory homelessness 2017/18 2.7 7.9 3.8 2.4 Infants receiving a 6-8 week review 90.1% 88.3% 89.6% 84.3% Depression prevalence (18+) 2017/18 8.9% 8.5% 8.8% 9.9% Mental health prevalence (all ages) Children receiving a 12 month review 85.2% 93.9% 87.9% 82.6% 2017/18 0.79% 0.86% 0.81% 0.94% Source: Perinatal Mental Health Profile, Fingertips, Public Health England Calculated by applying the national prevalence estimates to the total number of maternal episodes Note: These estimates do not take into account socioeconomic factors or other factors that are likely to cause local variation.
