Introduction to Meta-analysis in Stata

This workshop, presented by Dr. Christine R. Wells from UCLA, provides an in-depth exploration of meta-analysis in Stata. Participants will learn about systematic reviews, data collection and organization, running meta-analyses, interpreting results, creating graphs, and identifying biases. The focus is on continuous data, with valuable resources for further information. Advanced topics like meta-regression will not be covered.

Download Presentation

Please find below an Image/Link to download the presentation.
The content on the website is provided AS IS for your information and personal use only. It may not be sold, licensed, or shared on other websites without obtaining consent from the author. Download presentation by click this link. If you encounter any issues during the download, it is possible that the publisher has removed the file from their server.
E N D
Presentation Transcript
Introduction to Meta- analysis in Stata Presented by Christine R. Wells, Ph.D. Statistical Methods and Data Analytics UCLA Office of Advanced Research Computing
What to expect from this workshop What to expect from this workshop Definition of systematic review and meta-analysis Information on how to collect data for a systematic review and/or meta- analysis How to organize data for a meta-analysis How to run a meta-analysis and interpret the results How to make some useful graphs A brief discussion of the different types of biases that may compromise the results of a meta-analysis Resources for further information All examples will use continuous data; no examples of binary data are presented
What not to expect What not to expect This is not an introduction to the use of Stata software There will be no discussion of how to access and/or use electronic databases We will not cover any of the more advanced topics, such as meta- regression, multiple imputation of missing data or multilevel meta- analysis
Introduction Introduction
Introduction You hear about a new drug, treatment, diet plan, etc., that does something great Quote from author: This research needs to be replicated with more subjects before anyone should act on the results. You find that some of the studies replicated the results while others did not. Something odd: the greater the number of participants in a study, the more likely the study was to find a statistically significant result. As N goes up, the p-value goes down, holding everything else (e.g., alpha, effect size) constant.
Introduction - continued Adding more participants to a study doesn t make a treatment more or less effective. What you want to know is if the treatment matters in the real world. According to Wikipedia, in statistics, an effect size is a quantitative measure of the magnitude of a phenomenon . You are interested in the size of the effect, not in the statistical significance.
Introduction - continued Collecting information from many studies that tried to answer the same research question is like a meta-analysis. A meta-analysis is an analysis in which the observations are effect sizes (and estimates of their error) reported in other research, usually published research. To have an apples to apples comparison, you want each of the studies to be addressing a similar, if not the same, research question. You want the outcome measures used to be similar or the same, and the comparison group to be the same. Other things, such as the number of participants, need not be similar across studies.
Introduction - continued A systematic review is very similar to a meta-analysis, except the effect sizes (and other values) are not collected from the articles, and hence there is no statistical analysis of these data. Rather, the goal is to give a descriptive summary of the articles.
Four related quantities We need to pause briefly to have a quick discussion about power. Alpha: the probability of rejecting the null hypothesis when it is true; usually set at 0.05 Power: the probability of detecting an effect, given that the effect really does exist; either sought (when conducting an a priori power analysis) or observed (after the data have been collected) Effect size: quantitative measure of the magnitude of a phenomenon; estimated (when conducting an a priori power analysis) or observed (after the data have been collected) N: the number of subjects/participants/observations who participated in a primary research study or are needed for such a study.
Four related quantities - continued A few examples: Hold alpha and effect size constant: As N increases, power will increase Hold alpha and power constant: As effect size increases, N decreases Hold alpha and N constant: As effect size increases, power increases, and so does the probability of finding a statistically-significant effect increases
Guidelines Guidelines
Guidelines In many ways, meta-analysis is just like any other type of research. The key to both good research and good meta-analyses is planning. To help with that planning, there are published guidelines on how to conduct good systematic reviews and meta-analyses. It is very important that you review these guidelines before you get started, because you need to collect specific information during the data collection process, and you need to know what that information is. Also, many journals will not publish systematic reviews or meta- analyses if the relevant guidelines were not followed.
Guidelines - continued MOOSE: Meta-analysis Of Observational Studies in Epidemiology (http://statswrite.eu/pdf/MOOSE%20Statement.pdf and http://www.ijo.in/documents/14MOOSE_SS.pdf) STROBE: Strengthening The Reporting of OBservational studies in Epidemiology (https://www.strobe-statement.org/index.php?id=strobe-home and https://www.strobe-statement.org/index.php?id=available-checklists) CONSORT: CONsolidated Standards Of Reporting Trials (http://www.consort- statement.org/ and http://www.equator-network.org/reporting- guidelines/consort/) QUOROM: QUality Of Reporting Of Meta-analyses (https://journals.plos.org/plosntds/article/file?type=supplementary&id=info:doi/ 10.1371/journal.pntd.0000381.s002) PRISMA: Preferred Reporting Items for Systematic reviews and Meta-Analyses (http://www.prisma-statement.org/)
Guidelines - continued There are two organizations that do lots of research and publish many meta-analyses. Because these organizations publish many meta-analyses (and meta- analyses of meta-analyses), they help to set the standards for good meta-analyses. These organizations are the Cochrane Collaboration and the Campbell Collaboration.
Guidelines - continued The Cochrane Collaboration is an organization that collects data related to medicine and health care topics. Because of their focus is on high-quality data for international clients, they do a lot of meta- analyses. Not surprisingly, they wrote a whole book of guidelines on how to conduct both systematic reviews and meta-analyses.
Guidelines - continued The was Campbell Collaboration was founded in 1999 and is named after Donald T. Campbell This organization is like the Cochrane Collaboration, only for social issues. Their site has links to the Cochrane Collaboration guidelines, as well as to other sets of guidelines. Another useful website is from the Countway Library of Medicine: https://guides.library.harvard.edu/meta-analysis/guides .
Guidelines - continued This sounds like a lot of guidelines, but in truth, they are all very similar. Reading through some of them will give you a good idea of what information is needed in your write up. You will want to know this so that you can collect this information as you move through the data collection process.
Quality checklists Quality checklists
Quality checklists Almost all of the meta-analysis guidelines require that all of the studies included in the meta-analysis be rated on a quality checklist. There are hundreds of quality checklists that you can use. Some have been validated; many have not. You may find that you get different results when you use different quality checklists.
Quality checklists - continued The purpose of the quality checklist is to identify studies that are potentially not-so-good and ensure that such studies are not having an undo influence on the results of the meta-analysis. For example, if, according to the quality check list being used, one study was found to be of much lower quality than all of the others in the meta-analysis, you might do a sensitivity analysis in which you omit this study from the meta-analysis and then compare those results to those obtained when it is included in the meta-analysis.
Quality checklists - continued Keep in mind that reporting standards have changed over time witness the evolution of the American Psychological Association (APA) manuals. This can be an issue in meta-analyses that include studies dating back to the 1990s. Back in the 1990s, it was standard practice to report p-values as being above or below 0.05, but not the exact p-value itself. Also, the requirement to report effect sizes (and their standard errors) is relatively new, so older studies typically did not report them.
Data collection, etc. Data collection, etc.
Data collection Once you are familiar with the guidelines, you are ready to start the data collection process. The first step is to clearly state the research question. This is critical, because it will inform the criterion for what studies will be included in your meta-analysis and which will be excluded. Refining the research question may be necessary to increase or decrease the number of studies to be included in the meta-analysis.
Grey literature When deciding where you will search of articles, you will need to consider if you will include any of the so-called grey literature in your search. Grey literature includes articles that are either not published or published in journals that are not-so-easy to access (or journals in which the author paid a publication fee). There is often a question as to whether these articles have undergone the peer-review process. Other examples: Master s theses and dissertations government reports Non-governmental organizations (NGO) reports research/reports from businesses white papers conference proceedings/papers statements by professional organizations, etc.
Grey literature - continued There is some debate as to whether such research should be included in a meta-analysis. Because these articles have not been through the same type of peer review process that articles published in journals have, they may be of substantially lower quality: If it wasn t good enough to be published, why is it good enough to be in my meta-analysis? It may be difficult to access this type of literature, as there is no database to search, and so there may be selection bias with respect to those articles that are discovered and included. On the other hand, some argue that omitting such articles may lead to an inflated estimate of the summary effect size, as the effect sizes reported by grey literature articles will likely be smaller than those reported in published articles.
Inclusion and exclusion criteria Once the research question has been sufficiently refined, you now need to think about how to determine which studies will be included in your meta-analysis. In practice, instead of developing both inclusion and exclusion criterion, you may just develop exclusion criterion. So you will include all of the research articles you find, unless there is a reason to exclude the article.
Inclusion and exclusion criteria - continued Examples of exclusion criteria: Language: Articles not written in English. Date of publication: Articles published before 1980 or after 2016. Publication source: Article not published in a peer-reviewed journal. Type of research: Did not use an experimental design.
Inclusion and exclusion criteria - continued Where you are going to search for the articles? This is a very important step in the process, because your meta- analysis may be criticized if you don t search in all possible places and therefore fail to find and include studies that really should be included in the meta-analysis. You decisions regarding the inclusion or exclusion of grey literature becomes very important at this stage, because it will impact where you search for articles.
Inclusion and exclusion criteria - continued The next step is to start doing the search of the literature. While ideally you would have a complete list of the exclusion criteria before you start the literature search, the reality is that this may be an iterative process, as you find that items need to be added to the exclusion list as you do the searches. This may mean that some searches need to be done more than once. Remember as you do this to keep track of your search terms for each search, and all of the necessary information for writing up the results. Depending on your research question and your search parameters, you may find very few results or tens of thousands of results. Either of these may lead you to revise your exclusion criteria and/or your search terms.
Sensitivity and specificity Sensitivity: you get all of what you want. Your search results include all of the articles that should be included in your meta-analysis; nothing is missing. Specifity: you get none of what you don t want. You don t have articles that shouldn t be included in your meta-analysis. In practice, when doing the search of the literature, most researchers tend to error on the side of sensitivity, to ensure that no relevant study was missed. This means more work to sort through the possible studies to eliminate those that should not be included.
Collecting data Once you have a list of all possible articles to include in the meta- analysis, you need to determine what part of the article you will read in order to determine if the article should be included in the meta- analysis. You will likely have hundreds or thousands of possible articles, so reading each one in its entirety isn t realistic. You might read just the abstract, or just the methods section, for example.
Collecting data - continued Sorting through all of the possible studies takes a lot of time and effort. You need to be very organized so that you don t end up evaluating the same article multiple times. Usually, this job is done by more than one person. In this situation, some articles need to be evaluated by everyone doing the evaluation task, to ensure that everyone would make the same decision regarding that article (i.e., to include it in the study or not). This should be done early on, in case more training is needed. Consistency between evaluators is critical, and inter-rater agreement needs to be reported.
What information to collect Before you start collecting the actual data for the meta-analysis, decide which statistical software package will be used to analyze the data. Look at the help file for the command that you will be using. For this workshop, we will be using the meta analysis commands that were introduced in Stata 16. Looking at the help file for meta, you can see that there are several different ways that data file could be structured, depending on the type of data that are available.
What information to collect - continued The meta set command can be used if your dataset contains effects sizes their standard errors or effect sizes their confidence intervals. The meta esize command can be used if your dataset contains the means, standard deviations and sample sizes for two groups (usually an experimental group and a control group). The meta esize command can also be used if your dataset contains the Ns for successes and failures for two groups (for a total of four sample sizes).
What information to collect - continued With the meta set command, you dataset could be formatted in one of two ways: esvar sevar or es cilvar ciuvar where esvar means effect size , sevar means standard error of effect size , cilvar means confidence interval lower , and ciuvar means confidence interval upper .
What information to collect - continued With the meta esize command, your dataset could be formatted in one of two ways: Continuous data: n1 mean1 sd1 n2 mean2 sd2 n1 means the sample size for the experimental group, mean1 means the mean for the experimental group, sd1 means the standard deviation for the experimental group, n2 means the sample size for the control group, mean2 means the mean for the control group, sd2 means the standard deviation for the control group.
What information to collect - continued As you can see, there are several different ways you can enter data. You want to know which of these you will be using before you start collecting data. In the social sciences, you are likely to find Ns, means and standard deviations in the articles to be included in the meta-analysis. In medical fields, you may be more likely to find odds ratios. Either way, you need to know what information is needed by the software so that you know what to collect. Data collection is rarely that straight forward. You often end up with two datasets. The first one is the one into which you collect the information that you can find, and the second one is the cleaned up one that you use for the analysis.
What information to collect - continued Another thing you need to do before starting to collect the data is to determine how you are going to mark the data that you have found. Are you going to print out all of the articles and use a highlighter to highlight the needed values? Are you going to have a file of PDFs of the articles and use an electronic highlighter? As mentioned before, if more than one person is going to do this task, you will need to get the inter-rater reliability established before data collection begins.
What information to collect - continued Another point to consider is the possibility of running a meta- regression. We will not discuss the topic of meta-regressions in more detail later, but the point is to think about possible covariates that might be included in such a model. You want to think about that before reading through the selected sections of the articles, because you want to collect all of the needed data in as few readings as possible. Your first dataset may look rather messy and may not be in a form that is ready to be imported into Stata for analysis. This is OK; it is still a good start.
Break time! Before we take a short break, does anyone have any questions/comments/concerns?
Missing data Two types of missing data in meta-analyses: missing studies and missing values. The first type is missing studies (akin to unit non-response in survey data). The second type is missing values from a particular study (akin to item non- response). Let s start with missing values from the articles. How missing data are handled in a meta-analysis can very different from how missing data are handled in almost any other type of research. The cost of missing data in a meta-analysis is often high, because there is no way to get more data (because you have already included all of the relevant studies in your meta-analysis), and the number of studies may be rather low.
Missing data - continued Before trying to use a more traditional form of imputation, such as multiple imputation, in a meta-analysis you can try to find an acceptable method to replace the missing value using the information that is available. One of the best places I have found for information on making these substitutions is the manual for the ES program written by the late Will Shadish. This document describes the formulas used to calculate the different types of effect sizes and describes the consequences of substituting known information for unknown information.
Missing data - continued Suppose you are collecting Ns, means and standard deviations for your meta- analysis. You must find the N, mean and standard deviation for both the experimental and control group, for a total of six values. One of the articles gives only five values; the N for one of the groups is missing. You may be able to figure out what the N is by subtracting the N in one group from the known total sample size, but if you can t do that, you could just assume that each group had the same N. The effect size that is calculated with this substitution is very similar what would have been calculated if the real N had been know. If you had all but the standard deviation for one group, you might assume that the standard deviations in the two groups were equal. This is a little more of a compromise than assuming equal Ns, but it isn t too bad. However, you should be hesitant to assume that the means of the two groups were the same.
Missing data - continued The only information that you can find is the value of the F-statistic, the degrees of freedom, and the p-value. You can calculate an effect size from this information. If you can find only the p-value, you can still estimate the effect size. For example, if you have a p-value and the degrees of freedom, you can figure out the t-value, and then calculate an effect size from there. To do this, however, you need to have the exact p-value.
Missing data - continued What to do about missing studies? Of particular concern are the results of high-quality research that found non-significant results. Finding such research results can be difficult, as such research is published much less often than research that found statistically significant results.
Missing data - continued Another method of handling missing data is to contact the author(s) of the study with the missing data and ask for the value or values needed. In my experience, some authors were very understanding and provided the requested values, while others simply ignore such requests. One replied to our email request and said that she would be willing to provide the missing value (which was a mean), but the data were stored on a tape that was no longer readable. There is also the possibility of doing a multiple imputation or possibly a Bayesian meta-analysis, but we will not discuss those topics in this workshop.
Missing data continued So what are your options? You can try to contact researchers who have published articles in this particular area of research to ask about non-published papers. You can search for dissertations or Master s theses. You can talk to people at academic conferences. You can post inquiries on relevant mailing lists. However, caution must be exercised, because some of these works may be of substantially poorer quality than the work that is published. There could be flaws in the design, instrument construction, data collection techniques, etc. In other words, finding non-significant results isn t the only reason research is not published.
Different types of effect sizes Different types of effect sizes
Different types of effect sizes There are many different types of effect sizes, some for continuous outcome variables and others for binary outcome variables. The effect sizes for continuous outcome variables belong to one of two families of effect sizes: the d class and the r class. The d class effect sizes are usually calculated from the mean and standard deviation. They are a scaled difference between the means of two group. Glass delta, Cohen s d and Hedges g are examples of this type of effect size. Glass delta is the difference between the mean of the experimental and control groups divided by the standard deviation of the control group. Cohen s d is the different between the mean of the experimental and control group divided by the pooled standard deviation (i.e., pooled across the experimental and control groups). Hedges g is a correction to Cohen s d because Cohen s d tends to overestimate the effect size in small samples (< 10-15 total).
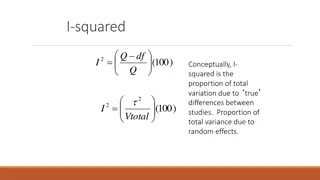
Different types of effect sizes - continued The r class effect sizes are also a ratio, but they are the ratio of variance attributable to an effect divided by the total effect, or more simply, the proportion of variance explained. Examples of this type of effect size include eta-squared and omega- squared.