Understanding Error Analysis in Physics Laboratories
Explore the concepts of error and uncertainty in physics laboratories through discussions on types of errors, accuracy vs. precision, and the impact of systematic, random, and human errors on measurements. Dive into the principles of error analysis to enhance your understanding of experimental data interpretation.

Download Presentation

Please find below an Image/Link to download the presentation.
The content on the website is provided AS IS for your information and personal use only. It may not be sold, licensed, or shared on other websites without obtaining consent from the author. Download presentation by click this link. If you encounter any issues during the download, it is possible that the publisher has removed the file from their server.
E N D
Presentation Transcript
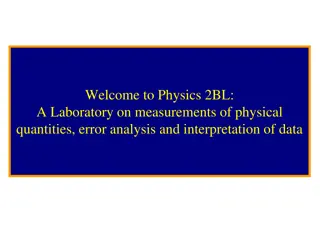
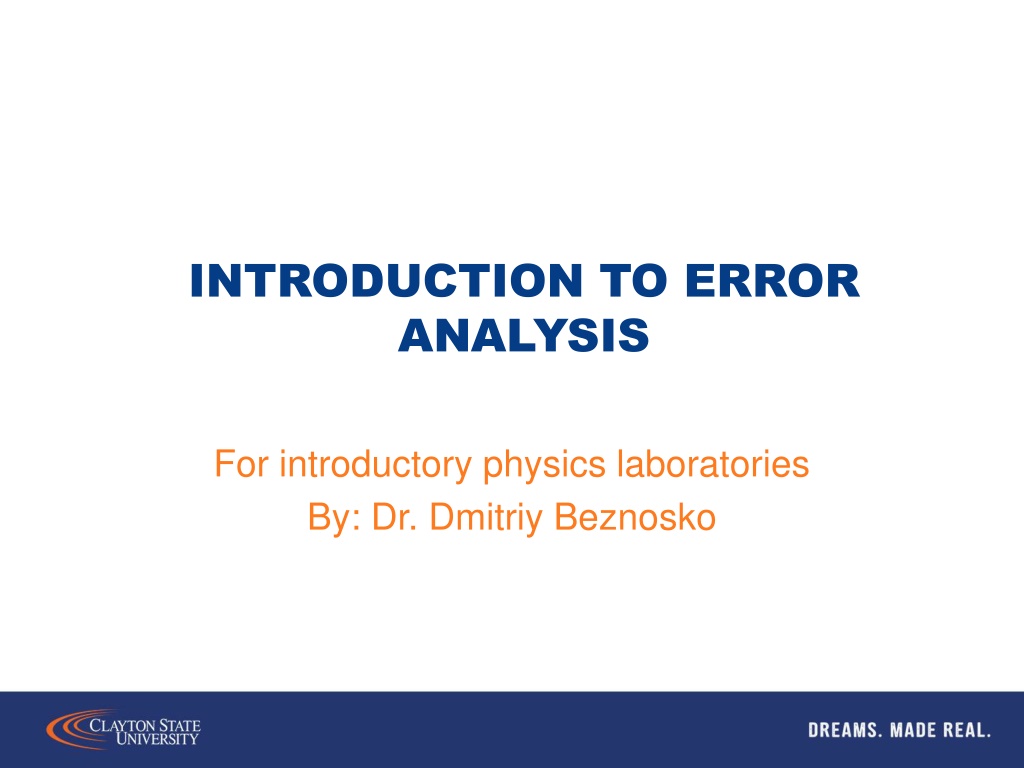
INTRODUCTION TO ERROR ANALYSIS For introductory physics laboratories By: Dr. Dmitriy Beznosko
TOPICS Error or uncertainty? Types and sources of error Normal is Gaussian? Standard deviation Confidence intervals Multiple measurements Read the Introduction to Error Analysis by Taylor or another recommended text. It is posted on the course website.
ERROR OR UNCERTAINTY? Every measurement you do (less your bank balance ) would have an uncertainty: either because you just can t make the exact measurement or because you are limited by your measuring device Think about measuring the length of your PC. It doesn t have exactly defined sharp edges, so where do you start? A ruler you use has finite number of divisions on its scale Different people will get different results The absolute minimal uncertainly is 0.5*smallest division (in some rare cases, 0.25 or full division should be used) Uncertainty is related to standard deviation and standard error, so the word error is often used for uncertainty
ACCURATE OR PRECISE? Accuracy : Describes how close is this measured value to the true value (or rather accepted one in practice). Relates to systematic error. Think about if you are measuring the length of your room but your friend played a prank on you and cut out a piece of the tape in the middle and glued it back Precision: Describes how reproducible is a given measurement. Relates to statistical error. Thus, measurement can be accurate and precise, accurate but not precise, and precise and not accurate. Watch out for the third one, its hard to catch!
TYPES OF ERRORS Systematic errors : these are due to built-in errors in the instrument: either in design or in calibration. Repetition of observation with the same instrument will not show a spread in the measurements. They are the hardest sorts of errors to detect. A scale that has been rigged? Random or statistical errors : these always lead to spread or distribution of results on repetition of the particular measurement. They may arise from fluctuations in either the physical parameters, or from statistical nature of the phenomenon, or judgment of the experimenter, or all of those and other factors. Back to measuring computer length Human, or careless errors: basically, means that you have screwed up. These are due to mistakes in reading scales or careless setting of markers, etc. They can be eliminated by repetition of readings by one or two observers. So, you can t justify your result with human error!
WHEN IN RANDOM, SAY GAUSS If your measurements are independent and there is no information exchange between any of them, then the outcome results will be distributed according to Gaussian (normal, bell-shaped) distribution.
WHAT IS STANDARD DEVIATION A student buys n=36 apples at the store. Then weighs each one and finds the mean ? = ? ?=1 ?? and the ? ? ?? ?2 ? ?=1 standard deviation ? = Geometrically, 1? would include about 68% of all apples, 2? would include 95% and 3? would include 99% of apples from the ones that were bought.
CI CONFIDENCE INTERVALS What if many students go and get apples at the same store? -rephrasing how are we confident that the mean and sigma the first student obtained described well the whole apple shipment? Imagine 99 more students go to the same store and buy same apples from it. And all make the same measurements to obtain the mean and the standard deviation. Could the first student from previous slide say something about all those measurements, or, rather the means that these 99 students obtain? Yes, if Confidence Interval formula is used (next slide). Standard deviation tells you about distribution of the data you already have, whereas confidence interval tells you about distribution of the means for other data sets that you or others may take for the same experiment/sample/setup. Theorem: the distribution of means of Gaussians from the same sample is also a Gaussian distribution.
C z* CI CONTINUED 99% 2.576 So, you found the mean and the standard deviation. Can you find the CI from this data? Yes! For the known Gaussian distribution: ?? = ? ? ? 98% 2.326 95% 1.96 ? z* is the value that depends on the C value (that is, confidence of 95%, 99% etc.). It is the CDF of your distribution in general Gaussian for this case, which is hard to find analytically. For ease, these z* values are tabulated So, our first student can estimate the interval that would contain 95% of measurements of apples all other students will make as 90% 1.645 ? ??(95) = ? 1.96 36
MULTIPLE MEASUREMENTS: For us, N=100 students got the apples. Each has a mean and standard deviation. If you combine the results, the standard deviation becomes what is called standard error (SE), or standard deviation of the mean, denoted as SE or ?? Given if all are the same (or very close then just average them), you will get that ??= deviation from a single measurement, thus getting a more precise measurement. ? ? and you reduce your standard
HOW TO SHOW YOUR ANSWER In physics, the result of your measurement should typically be given as 1? If you are asked to find CI, then you should give ??????? (??95), or similarly indicate that it s the CI, not the sigma. Some sciences ask for CI instead by default, so you should be careful.
ERROR BARS ON A PLOT When making a plot, all points should have the error bars. Error bars are again, typically 1? but can be CI(95) or other values, so somewhere in the text or figure caption this should be mentioned at least once in the report Normally, there are x and y error bars, but for most experiments x-bars could be very small and thus are omitted. In some cases, the x-axis can be the experiment name or trial number that will have no error, associated with it. Label axes! Plot title is optional Name plots as Figure 1 Always use caption! e.g. Figure 5: testing of
PRACTICE ASSIGNMENT Get together with 2-3 friends Take any ruler or measuring tape Pick a thing to measure (i.e. monitor, PC, desk, chair, etc.) First, try to estimate what the measurement error should be Then, each of you take turns to measure this length. Write down your result and don t tell the others until the end of measuring process (why?). If your turn comes up again, do your best to forget the previous measurement. Do at least 10 measurements. Find the average and standard deviation. How close was your prediction of measurement error to your measurement standard deviation? Why? Calculate the CI(95) for your result. What does it represent? Read about Poisson distribution. How is it different from Gaussian?