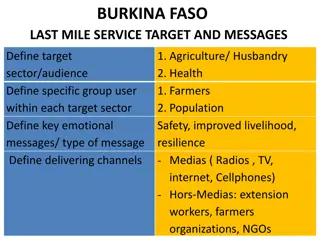
Examining the Impact of Maternal Education on Child Health in Burkina Faso
Research focuses on child health outcomes in Burkina Faso, exploring the link between maternal education and child well-being. It addresses the prevalence rates of stunting, school enrollment, and education policies in the country. Objectives include studying causal relationships and potential threshold effects of maternal education on child health.

Download Presentation

Please find below an Image/Link to download the presentation.
The content on the website is provided AS IS for your information and personal use only. It may not be sold, licensed, or shared on other websites without obtaining consent from the author. Download presentation by click this link. If you encounter any issues during the download, it is possible that the publisher has removed the file from their server.
E N D
Presentation Transcript
By Eugenie W. H. Ma ga African Center for Economic Transformation (ACET)
Background on Burkina Faso Land area = 274,000 km2, Population =15.21 million (2008), GNI per capita =$480 (2008). In Burkina Faso, the prevalence rate for stunting (height-for-age) was 39% in 2003. In 2009 the gross school enrolment rate for primary, secondary, and higher education were 78%, 20%, and 3%, respectively.
Gross enrollment rates in primary school by province in 2004-2005 Source: Ministere de l Enseignement de Base et de l Alphabetisation, 2005
Research problem Child health and nutrition outcomes in developing countries are disappointing (prevalence of stunting in preschool children was 33% in 2000, De Onis et. al., rates between 30% and 39% are considered high). Link between child health and child nutrition: malnourished children are more likely to develop illnesses that can have long lasting effects throughout their lives. Mothers play an important role in child nutrition. How does her education come into play?
Why are child health outcomes important? Costs of related illnesses (physical suffering, time costs and monetary costs). Impacts on ability to learn i.e. on schooling outcomes. Impacts on productivity later in life which could adversely affect economic growth
Objectives General objective: Examine the relationship between maternal education and child health in Burkina Faso Specific objectives: Verify whether a strong causal relationship exists Understand the channels through which mother s education affects child health investigate whether threshold effects exist, that is, whether specific years or levels of mothers education have unusually large impacts on children s health.
Change in education policy in Burkina Faso Primary education: construction of 3-year primary schools Ecoles Satellites, ES) in areas of 28 provinces (out of 45) where enrolment rates are low. As of 2008, there were 304 ES. Became effective in the school year 1995-1996. Instruction is done in two languages, French and language spoken in the area. Trying to favor girls enrollment in those schools
Evolution of enrollment rates in provinces with and without the program Provinces with program Provinces without program
Previous Evidence Empirical studies without pathways (did not use natural experiment): Baya (1998), Appoh and Krekling(2005). Empirical studies without pathways (used natural experiment): Breierova and Duflo (2004) and Chou et. al. (2007). Empirical studies with pathway(s): Thomas et al. (1991), Glewwe (1999), Handa (1999), and Webb and Block (2004).
Contribution Many have studied the subject but few studies have used natural experiments (change in policy) in identifying the relationship between mother s education and child health in developing countries Use of distance to school as IV for mother s education in a study of the impact of mother s education on child health Use of both natural experiment and pathways
Conceptual framework Draws on Becker s model of the family, and Rosenzweig and Schultz (1983) health production function Consider the following equations: ( h H = = X ( p , ) U u H = Z I + , , ) + X Z I M p p 1 2 3 Where X is market goods, Z represents goods that affect child health, H is child health, I represents inputs that affect utility only through their effect on H and is child health endowment.
Conceptual framework Estimating H requires detailed data on health inputs, data which are not available to this study. A way out of that, is to use reduced form equations. Maximizing U subject to the health production and the budget constraint yields reduced-form demand functions for X, Z, H and I.
Data Main source: Burkina Faso 2007 Enquete sur les conditions de vie des menages (survey of living standards). Additional data sources include the ministry of primary education (policy change data: number, location, and year of construction of the schools, and enrollment information) and Internet sources (distance calculator). Distance between the closest school (village/city name) and the household village/city of residence computed using distance calculator at www.infoplease.com/atlas/calculate-distance.html
Descriptive Statistics: Child Characteristics Std. Dev. 16.8 0.50 Variable Child s age in months Male Obs 2,003 2,007 Mean Min Max 27.3 52.7% 0 0 59 1 HAZ Stunting Moderate stunting Severe stunting 2,003 2,003 2,003 2,003 -1.8 2.05 0.50 0.40 0.45 -5.98 5.8 47.6% 19.4% 28.3% 0 0 0 1 1 1 WHZ Wasting Moderate wasting Severe wasting 1,932 1,932 1,932 1,932 -0.3 2.04 0.40 0.29 0.32 -4.96 5 1 1 1 20.7% 9.5% 11.2% 0 0 0
Descriptive Statistics: Regressors Variable Zero to 5km of program school Five to 10km of program school Number of years ES was available Mother s years of education Mother s age Father s years of education Father s age Monthly expenditures (1,000 FCFA) Urban residence Television Radio Refrigerator Bicycle Moped Car Electricity Cell phone Mother s health knowledge Mother s bargaining power Obs 2,007 2,007 2,007 2,007 2,007 2,007 2,004 2,005 2,007 2,007 2,007 2,007 2,007 2,007 2,007 2,007 2,007 2,007 2,007 Mean Std. Dev. 6.9% 10.1% 0.4 1.4 24.3 2.1 35.7 8.2 24.5% 20.1% 74.9% 5.4% 86.8% 38.5% 2.4% 15.8% 25.0% 3.7 65.4% Min Max 0 0 0 0 14 0 15 0 0 0 0 0 0 0 0 0 0 0 0 0.25 0.30 1.05 3.12 3.29 4.15 11.44 12.44 0.43 0.40 0.43 0.23 0.34 0.49 0.15 0.37 0.43 1.80 0.48 1 1 5 17 29 17 97 225 1 1 1 1 1 1 1 1 1 8 1
Descriptive Statistics: Histogram of parents education .8 .8 .6 .6 Fraction Fraction .4 .4 .2 .2 0 0 0 5 10 15 20 0 5 10 15 20 momedu_years dadedu_years
Selected child health outcomes by parents education Stunting Wasting Mother schooling No schooling 50.7% 21.5% Some schooling Father s schooling No schooling 36.1% 17.5% 51.2% 21.2% Some schooling Total 38.4% 19.2% 47.6% 20.7%
Methods and Procedures Parents education and child health maybe affected by many unobservables . To identify the effect parents education on child health, I will use a system of equations: = = + + + + + + Z X S i k i + + X H S i k i i
Methods and procedures Use two-stage least squares to estimate the system (education equation and child health equation) with the primary education program as an instrument for mother s education. Add income, mother health knowledge, mother s bargaining power, etc. to the child health equation and estimate it.
Table 1:OLS Estimates of Mothers Health Knowledge, Bargaining Power, and Household Expenditures on Mother s Education and other Variables. OLS OLS Health knowledge OLS Per capita expenditures VARIABLES Bargain power 0.300*** (0.031) 0.541*** (0.064) 0.084* (0.049) 0.041*** (0.013) -0.158*** (0.043) -0.001 (0.004) 0.499*** (0.117) 0.225* (0.128) 0.416*** (0.094) -0.023 (0.018) -0.022 (0.014) 0.018*** (0.004) -0.028** (0.013) -0.000 (0.001) -0.137*** (0.037) -0.064 (0.041) -0.016 (0.026) Mother s education (log) Per capita expenditures (log) -0.001 (0.007) -0.125*** (0.021) -0.007*** (0.002) 0.370*** (0.052) Mother s age Father s education (log) Father s age Urban residence Has a television Has a radio Observations R-squared 1,934 0.164 1,934 0.173 1,934 0.056
Table 2: Reduced Form Estimates for Child Height-for-Age (HAZ): Pathways Added Health Knowledge HAZ Bargaining power HAZ Community services HAZ Base FE HAZ Income HAZ All pathways HAZ VARIABLES 0.133** (0.064) -0.204*** (0.035) -0.008 (0.053) 0.083 (0.061) -0.203*** (0.035) -0.005 (0.054) 0.123* (0.064) -0.204*** (0.035) -0.008 (0.053) 0.139** (0.065) -0.204*** (0.035) -0.006 (0.053) 0.130* (0.065) -0.203*** (0.035) -0.008 (0.054) 0.079 (0.062) -0.203*** (0.035) -0.004 (0.054) Mother s education (log) Child s age (months) Father s education Per capita expenditures (log) 0.169*** (0.060) 0.170*** (0.061) 0.012 (0.027) 0.152 (0.119) Health knowledge 0.017 (0.027) Bargaining power 0.143 (0.122) Within 30 minutes of a health clinic 0.044 (0.107) 0.035 (0.105) Observations R-squared 2,000 0.101 1,998 0.104 2,000 0.101 2,000 0.102 2,000 0.101 1,998 0.105 Number of provinces 43 43 43 43 43 43
Table 3: Reduced Form Estimates for Child Weight-for-Height (WHZ): Pathways Added Health Knowledge WHZ Bargaining power WHZ Community services WHZ All Base FE WHZ Income WHZ pathways WHZ VARIABLES 0.164* (0.086) 0.011*** (0.003) -0.140** (0.058) 0.157* (0.087) 0.011*** (0.004) -0.142** (0.059) 0.008 (0.072) 0.165* (0.087) 0.011*** (0.003) -0.140** (0.057) 0.156* (0.086) 0.012*** (0.003) -0.143** (0.059) 0.166* (0.082) 0.011*** (0.003) -0.140** (0.058) 0.154* (0.087) 0.012*** (0.004) -0.145** (0.059) 0.004 (0.071) -0.003 (0.037) -0.218** (0.096) Mother s education (log) Age in months Father s education Per capita expenditures (log) Health Knowledge -0.002 (0.038) Bargaining power -0.221** (0.097) Within 30 minutes of a health clinic -0.021 (0.111) -0.029 (0.117) Observations R-squared 1,925 0.020 1,923 0.020 1,925 0.020 1,925 0.022 1,925 0.020 1,923 0.022 Number of provinces 43 43 43 43 43 43
Table 4: First Stage IV Regression for Child Weight-for-Height (WHZ) Per capita expenditures 0.068 (0.092) 0.010 (0.079) Mother s education -0.041 (0.066) 0.157** (0.076) Mother s education -0.008 (0.049) 0.163** (0.071) VARIABLES Zero to 5km of ES (d1) Five to 10km of ES (d2) Number of years ES was available (ESyears) -0.016 (0.020) 0.349*** (0.107) -0.049 (0.045) -0.003 (0.019) 0.407*** (0.124) -0.020 (0.042) 0.072*** (0.010) -0.023 (0.030) 0.031 (0.035) 0.368*** (0.027) 1923 0.299 0.007 (0.027) -0.168** (0.066) 0.048 (0.045) 0.028** (0.013) -0.035 (0.044) -0.007 (0.041) 0.320*** (0.026) 1923 0.161 Interaction d1*ESyears Interaction d2*ESyears Health knowledge Bargaining power Within 30 minutes of a health clinic Wealth index Observations R-squared 1925 0.117
Table 5: Second Stage IV Regressions for Child Weight-for-Height (WHZ) Basic model WHZ Full model without income WHZ Full model with income WHZ VARIABLES 1.735*** (0.579) 0.016*** (0.004) -0.163** (0.071) 1.736*** (0.551) 0.016*** (0.004) -0.157** (0.071) -0.162*** (0.062) -0.163 (0.129) 1.287*** (0.326) 0.012*** (0.004) -0.177** (0.070) -0.065 (0.040) -0.287** (0.126) Mother s education (log) Age in months Father s education Health knowledge Bargaining power Within 30 minutes of a health clinic -0.145 (0.149) -0.033 (0.130) Per capita expenditures (log) -1.113*** (0.394) Observations R-squared Number of provinces 1,925 -0.244 43 1,925 -0.224 43 1,923 -0.227 43
Threshold effects WHZ threshold regression coefficients HAZ threshold regression coefficients 3 2 2 1 Parameter estimate Parameter estimate 1 0 0 -1 -1 -2 -2 0 _Imomedu_ye_5 Mother's years of education _Imomedu_ye_10 log_pce 0 _Imomedu_ye_5 Mother's years of education _Imomedu_ye_10 log_pce
Summary of results Strong positive coefficient of mother s education on WHZ (IV/FE estimation) Positive but insignificant coefficient of mother s education for HAZ (OLS estimation). Household per capita expenditures are a pathway for impact on HAZ. Counterintuitive sign of father s education, bargaining power and household expenditures in WHZ regression.
Summary of results Evidence of existence of threshold effects but need to consider the cost. Keep girls in school as long as possible; design nutrition programs targeted at girls/women. Limitations: could not IV mother s health knowledge, quality of bargaining power and health knowledge variables, no information on religion and ethnicity.
Table A1: First Stage IV Regressions for Child Height-for-Age (HAZ) Per capita expenditures 0.025 (0.091) 0.023 (0.076) 0.001 (0.027) -0.165** (0.067) 0.049 (0.045) 0.030** (0.013) -0.029 (0.044) -0.004 (0.040) 0.314*** (0.026) 1,998 0.157 27.03 0.000 Mother s education -0.045 (0.063) 0.155** (0.074) -0.013 (0.020) 0.326*** (0.106) -0.051 (0.044) Mother s education -0.001 (0.059) 0.169** (0.074) -0.007 (0.019) 0.329*** (0.112) -0.042 (0.044) 0.095*** (0.011) -0.084** (0.033) 0.108*** (0.037) Mother s education -0.006 (0.047) 0.156** (0.069) -0.001 (0.019) 0.380*** (0.123) -0.019 (0.042) 0.070*** (0.010) -0.026 (0.030) 0.030 (0.034) 0.362*** (0.027) 1,998 0.296 32.45 0.000 VARIABLES Zero to 5km of ES (d1) Five to 10km of ES (d2) Number of years ES was available Interaction d1*ESyears Interaction d2*ESyears Health knowledge Bargaining power Within 30 minutes of a health clinic Wealth index Observations R-squared F (test of excluded instruments) P-value of F-test 2,000 0.116 3.11 0.008 2,000 0.177 2.91 0.013
Table A2: Second Stage IV Regressions for Child Height-for-Age (HAZ) Basic model HAZ Full model without income HAZ Full model with income HAZ VARIABLES -0.637 (0.514) -0.206*** (0.029) 0.028 (0.061) 0.726* (0.387) -0.739 (0.521) -0.207*** (0.029) 0.024 (0.061) 0.713** (0.331) 0.093 (0.058) 0.130 (0.114) -0.355 (0.301) -0.199*** (0.028) 0.034 (0.061) 0.030 (0.204) 0.020 (0.034) 0.217** (0.106) Mother s education Child s age (months) Father s education Urban residence Health knowledge Bargaining power Within 30 minutes of a health clinic 0.118 (0.128) 0.030 (0.111) 0.713* (0.364) Per capita expenditures Observations R-squared 2,000 0.047 2,000 0.038 1,998 0.054