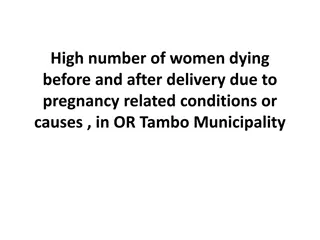
Child, Maternal, and Adult Mortality in Ethiopia: A Study on Age-Cause-Specific Mortality Distribution

The study focuses on the mortality rates in Ethiopia, highlighting the challenges in rural areas and the high maternal mortality. It discusses the implementation of CRVS and the use of VAs to identify causes of death, particularly in rural regions. The objectives include analyzing age-cause-specific mortality distribution in the East Gojjam Zone of Amhara region. The methodology involved sampling deaths below 70 years old, with a focus on child, maternal, and adult mortality over the past three years in different ecological zones.

Download Presentation

Please find below an Image/Link to download the presentation.
The content on the website is provided AS IS for your information and personal use only. It may not be sold, licensed, or shared on other websites without obtaining consent from the author. Download presentation by click this link. If you encounter any issues during the download, it is possible that the publisher has removed the file from their server.
E N D
Presentation Transcript
Child, maternal, and adult mortality in Ethiopia Wubegzier Mekonnen SPH, CHS, AAU Freetown, Sierra Leone November 29, 2022
Introduction Substantial morbidity and mortality reductions, and gains in life expectancy for both sexes is witnessed in Ethiopia through its HSTP/HEP Mortality remains high predominantly in rural areas where over 80% of Ethiopians live Premature mortality remains a major concern in Ethiopia and maternal mortality is still high Most deaths still occur in the community away from health facilities Inaccessibility and low usage of the health system, cost burden, and inadequacy lead to unregistered deaths at home without medical care. CRVS, the robust death identification, started in 2016 in Ethiopia
Introduction CRVS without a procedure to identify causes for deaths happening at home was in place To supplement CRVS, VAs were conducted for deaths captured through the RVERA of Amhara region (predominantly rural, the 2nd largest with a highest number of deaths) VAs prove a suitable alternative to obtain reliable direct estimates on COD
Objectives The main aim of this study is to show the age-cause-specific mortality distribution of the Ethiopian population using the CRVS cause of death records in East Gojam zone of Amhara region
Methods (Sampling frame) (Sampling frame) The SPH/AAU and EPHA did this study during December 2019 -April 2020 in East Gojjam Zone (EGZ) with technical support from the CGHR/UoT EGZ is situated in Amhara region and has three ecologic zones (lowland, mid land, and high land) and 21 districts (Woreda). The population of EGZ and Amhara region were approximately 2.1 and 17.2 million respectively. The majority (1.9 million; 90.1%) of EGZ s population and districts is rural(CSA, 2007) The sample comprised deaths recorded in villages in each ecological zone and residence type, which is 2% of the total deaths in the zone All deaths below the age of 70 years captured by the regional VERA since the inception of the CRVS in Ethiopia (August 8, 2016) were considered as sampling frame. Deaths for older adults (70+ years) were excluded due to the higher probability of misclassification of COD at older ages
Methods (Sampling frame, contd) (Sampling frame, cont d) For child and maternal mortality, all neonatal (0-28 days), childhood (29 days-14 years) and maternal deaths registered in the past three years in each district were included For adult mortality (15- 69 years), we used sampling probability proportionate to size technique to select deaths. The target sample was 3500 deaths from the regional VERA and the additional household enumeration. For the latter, ten more adjacent households to each VERA recorded death (38 500 households overall) were enumerated to capture death.
Methods (Ethical considerations (Ethical considerations) Clearance from SPH/REC, CHS/IRB and NRERC/MoST Support letter from RVERA, zonal VERA, MoH, RHB , ZHD, District Admin and District Hos Oral consent from each study participant
Methods (Enumeration, baseline survey, and e-VA) Enumeration and e-VA started in December 2019 after the data management system test was completed e-VA data collection tools for neonates, children, and adults are adapted from the WHO 2016 The e-VA tools are available in English and includes structured questions and a narrative section to document the signs, symptoms and events leading to death. The enumeration and e-VA tools are fully functional as offline applications with an integral database that permits real-time data validation, audio recording, random resampling (review of records for quality control and consistency) and surveyor feedback.
Methods (Enumeration, baseline survey, and e-VA) 25 surveyors and two coordinators who were given special training in two rounds for two weeks each were deployed E-VAs were completed for all deaths that were captured by the CRVS in the previous three years and on those additional deaths that hadn t been recorded by it in ten households around the index household E-VA was conducted on a total of 3516 death cases The surveyors completed data collection in all districts of East Gojjam Zone in April 2020.
Methods (Central cause of death determination and collation) After a thorough independent and anonymous review of the e-VA narrative, two of 15 physicians trained on death certification and the ICD-10 coding of VA, anonymously assigned an ICD code to each death The assigned ICD code denotes the underlying cause of death. For maternal deaths among females aged 15-49 years, the ICD codes followed the WHO ICD maternal death coding guidelines for direct (underlying) and indirect (contributory) causes Where the two ICD codes assigned for each death differed, the two physicians undertook a reconciliation of differences with a review of key words. If disagreements persisted thereafter, a senior physician adjudicated the final ICD code. Coding was done on or offline with internet connection needed occasionally for data management. We followed the WHO Global Health Estimates (GHE) standard death classification system with 45 distinct groups of causes to group the coded deaths. This was adapted, like in other studies, for the 344 unique ICD-10 codes in this study.
Methods( (Statistical analysis) Sex-specific national death totals and mortality rates were derived for children aged 5-14 years, and adults aged 15 29 years and 30 69 years by applying the study sample-weighted proportions of deaths to the 2019 death, population, and livebirth estimates from the UN World Population Prospects (2022). For neonates (aged 0-28 days), we used the 2019 UNICEF proportional neonatal mortality rate to calculate national death estimates. We also derived national totals for stillbirths by applying the weighted proportion to perinatal (stillbirth and neonatal) deaths estimated by UNICEF. National estimates for 1-59 month deaths were calculated by subtracting neonatal deaths (estimated using the UNICEF 2019 neonatal mortality rate of 27.8/1000 live births) from under-5 deaths (estimated using the UNICEF 2019 under-5 mortality rate of 50.8/1000 live births).
Methods( (Statistical analysis) To estimate national maternal deaths, we applied the study-weighted proportion to the UN 2019 death total for females 15 49 years of age. We estimated risk of death for all age groups and computed 95% CIs based on the delta method (nonlinear variance estimation) for the age-specific and cause-specific rates. We disaggregated the age groups to further examine deaths from suicides and tuberculosis. Ethiopia s cause-specific mortality estimates were compared with the 2019 WHO Global Health Estimates, which combines WHO program and model generated data. We used Stata version 16 software for analyses.
Results 38500 households were enumerated Two independent physicians assigned ICD-10 codes to 3516 deaths with about 71% concordance The remaining death records with conflicting ICD codes were resolved at reconciliation (14%) or adjudication (14%) by a senior physician. Most deaths (68%) occurred at home for all age groups and 3% happened on route to hospital or health facility. Majority of deaths (3388; 97%) occurred in rural areas. There were 55.3% (1943) males and 44.74% (females).
Results (neonatal deaths Annual mortality rate (per 1000 livebirths) 5.69 (5.62- 5.77) Study deaths (male/fe male) Percent of total (weighte d) National annual deaths Risk of death % Neonatal deaths were predominantly male with 158 (65.6%) of the total 241 deaths About 70% (172) occurred at home. The estimated neonatal mortality rate was 27.8 deaths per 1000 livebirths (95% CI 27.6- 27.9) and 105 094 neonatal deaths in 2019. Birth injury (birth asphyxia and trauma) and prematurity or low birthweight each accounted for 25% (26 355 and 26 359 respectively) of neonatal deaths and about 17% were due to sepsis. More stillbirths (19) were male than female (11) with 43.3% occurring at home. The annual stillbirth rate was 5.69 per 1000 births. A national estimate of 22 028 stillbirths based on weighted proportion applied to the denominator for livebirths and stillbirths occurred in Ethiopia. Neonatal Cause of death 30 Stillbirths NA 22028 11.3 (19/11) Neonatal deaths Birth asphyxia and birth trauma Prematurity and low birthweight 62 6.97 (6.89- 7.05) 6.97 (6.89- 7.05) 4.88 (4.81- 4.95) 4.61 (4.54- 4.68) 2.14 (2.09- 2.19) 2.22 (2.17- 2.27) 27.79 (27.62- 27.96) 0.70 26355 25.1 (43/19) 59 (41/18) 43 (21/22) 43 (31/12) 0.70 26359 25.1 Neonatal pneumonia 0.49 18461 17.6 Sepsis 0.46 17431 16.6 Other non- communicable diseases Ill-defined or cause unknown 0.21 22 (13/9) 8107 7.7 0.22 12 (9/3) 8380 8 All neonatal deaths 2.78 241 105094 100 (158/83)
Results (Child 1-59 months) There were 344 deaths among children under age five years (excluding neonatal deaths) with 80.8% of these deaths occurring at home. There were more male (188; 54.7%) than female (156; 45.3%) deaths and a risk of 2.18% of dying before attaining age five years. The mortality rate for this age group was 21.81 (95% CI 21.66-21.96) per 1000 livebirths with a national estimate of 82 467 deaths. The leading causes of death were pneumonia with 117 deaths and a national estimate of 27 058 and diarrheal diseases with a national estimate of 11 438 deaths. These two accounted for 46.7% of deaths among children aged 1-59 months. 1-59 months deaths 117 (56/61) Pneumonia 7.16 (7.08-7.25) 0.72 27058 32.8 49 Diarrhoeal diseases 3.02 (2.97-3.08) 0.30 11438 13.9 (27/22) 48 Injuries 3.24 (3.18-3.3) 0.32 12269 14.9 (26/22) Other non- communicable diseases 39 2.76 (2.71-2.81) 0.28 10434 12.7 (25/14) 22 Meningitis/encephalitis 1.76 (1.72-1.8) 0.18 6652 8.1 (14/8) 14 Tuberculosis 0.79 (0.76-0.82) 0.08 2987 3.6 (10/4) Other infectious and parasitic diseases 0.99 (0.96-1.02) 0.10 14 (7/7) 3758 4.6 Nutritional diseases 0.84 (0.81-0.87) 0.08 12 (5/7) 3160 3.8 Acute bacterial sepsis and severe infections 0.3 (0.28-0.32) 0.03 9 (6/3) 1140 1.4 Ill-defined or cause unknown 20 0.94 (0.91-0.97) 0.09 3572 4.3 (12/8) 344 (188/156 ) 21.81 (21.66- 21.96) All 1-59 months deaths 2.18 82467 100
Results( (Maternal mortality) Percent of female 15-49y deaths (weight ed) Maternal mortality ratio, per 100,000 livebirths Lifeti me risk % Maternal deaths There were 112 maternal deaths recorded in this study of whom 15% happened at home. The maternal mortality ratio was 335 maternal deaths per 100 000 livebirths (95% CI 329-341) and a lifetime risk of 1.6%. About 18% (12 650) of deaths among females age 15-49 years were due to maternal causes. Obstetric hemorrhage was the leading cause of death accounting for 46.7% (5910) of all maternal deaths. Other direct causes (maternal sepsis, abortion/miscarriage, and hypertensive disorders of pregnancy) accounted for 12.1% of deaths Direct causes 88 10647 14.7 282 (277-287) 1.3 Obstetric hemorrhage Other maternal conditions 49 5910 8.2 156 (152-160) 0.7 25 3204 4.4 85 (82-88) 0.4 Other direct causes* 14 1533 2.1 41 (39-43) 0.2 Indirect causes 24 2003 2.8 53 (51-55) 0.3 Communicable diseases other indirect 11 862 1.2 23 (22-25) 0.1 13 1141 1.6 30 (28-32) 0.1 causes All maternal deaths 112 12650 17.5 335 (329-341) 1.6
Natio nal annu al death s Percen t of total (weigh ted) Study deaths (male/fema le) Annual mortality rate (per 100,000 population) Results (Child 5-14) Perio d risk % Cause of death Of the 206 deaths among children aged 5 to 14 years, 61.2% occurred at home. Males accounted for 60.7% (125) deaths compared to females. The risk of death for children who had reached age five years before age 15 years was 1.92%. The mortality rate for this age group was 192.34 deaths per 100 000 population (95% CI 190.76-193.93) with 56 716 deaths occurring nationally for this group. Injuries were the leading cause of death with 35.5% of all deaths 5-14 years deaths 68.28 (67.34- 69.23) 40.56 (39.84- 41.29) 19.85 (19.35- 20.37) 13.06 (12.65- 13.48) 10.02 (9.67- 10.39) 10.01 (9.66- 10.38) 13.76 (13.34- 14.19) 12.18 (11.79- 12.58) 4.63 (4.39- 4.88) 192.34 (190.76- 193.93) Injuries 75 (49/26) 20135 35.5 0.68 Other non-communicable diseases 46 (23/23) 11959 21.1 0.41 Diarrhoeal diseases 21 (11/10) 5853 10.3 0.20 Meningitis/encephalitis 12 (7/5) 3850 6.8 0.13 Pneumonia 12 (10/2) 2956 5.2 0.10 Other infectious and parasitic diseases 12 (10/2) 2952 5.2 0.10 Tuberculosis 12 (6/6) 4056 7.2 0.14 HIV/AIDS 10 (5/5) 3591 6.3 0.12 Ill defined or cause unknown 6 (4/2) 1364 2.4 0.05 206 All 5-14 years deaths 56716 100 1.92 (125/81)
15-29 years deaths 54.69 (53.91- 55.49) 33.27 (32.66- 33.89) 29.32 (28.75- 29.9) 18.68 (18.22- 19.15) 18.31 (17.86- 18.77) 16.16 (15.74- 16.6) 17.58 (17.14- 18.03) 13.61 (13.22- 14.01) 13.4 (13.01- 13.8) 13.68 (13.29- 14.08) Results (Young adult (15-29 years) For young adults in the 15 to 29 years age group, we recorded 591 (346 males; 245 females) deaths representing 92 232 deaths in the nation. For this group, the risk of dying before reaching age 30 years was 4.11% for individuals having attained the age of 15 years and; The mortality rate was 274.26 (95% CI 272.5-276.04). About 51% of deaths occurred at home. Injuries (self-inflicted, unintentional, interpersonal, and traffic accidents) accounted for 50% (45 726) of deaths Self-inflicted injuries (suicide) 119 (68/51) 18392 19.9 0.82 Other unintentional injuries 79 (34/11 11190 12.1 0.50 Interpersonal violence & other intentional injuries 56 (47/9) 9861 10.7 0.44 Road traffic accidents 45 (34/11) 6283 6.8 0.28 Tuberculosis 40 (19/21) 6159 6.7 0.27 All vascular 38 (19/19) 5435 5.9 0.24 Maternal conditions 36 (0/36) 5913 6.4 0.26 All cancers 30 (16/14) 4578 5 0.20 HIV/AIDS 29 (10/19) 4505 4.9 0.20 Other infectious conditions 25 (15/10) 4602 5 0.21 Diarrhoeal diseases 17 (7/10) 2528 2.7 7.52 (7.23-7.82) 0.11 Epilepsy 17 (9/8) 3161 3.4 9.4 (9.08-9.73) 0.14 Nephritis and nephrosis 15 (9/5) 2075 2.2 6.17 (5.91-6.44) 0.09 Other non-communicable diseases 15 (11/4) 2157 2.3 6.41 (6.15-6.69) 0.10 Meningitis/encephalitis 14 (9/5) 2420 2.6 7.2 (6.92-7.49) 0.11 Other Ill-defined and abnormal findings 16 (7/9) 2975 3.2 8.85 (8.54-9.17) 0.13 274.26 (272.5- 276.04) All 15-29 years deaths 591 (346/245) 92232 100 4.11
Results( (Middle age adult (30-69 years) We estimated that about 30% of adults who reach age 30 years will die before age 70 years in Ethiopia by 239 047 deaths per year. Individuals in this age group accounted for about 60% (2104) of all study deaths and 71.34% of these occurred at home. About 53% of deaths in this age group were male. Vascular diseases (34 185) and cancers (30 761) caused 27.2% of deaths with high mortality rates of 106.92 (95% CI 105.79- 108.06) and 96.21 (95% CI 95.14-97.29) deaths per 100 000 population respectively. Other leading causes were tuberculosis (26 936; 11.3%), and HIV/AIDS (19 204; 8%). Injuries accounted for 13.2% (31 477) of deaths Overall mortality rates for this age group was 747.67 (95% CI 744.68-750.67) deaths per 100 000 population. 30-69 years deaths All vascular 311 (142/169) 34185 14.3 106.92 (105.79-108.06) 4.28 All cancers 296 (140/156) 30761 12.9 96.21 (95.14-97.29) 3.85 Tuberculosis 234 (106/128) 26936 11.3 84.25 (83.25-85.26) 3.37 HIV/AIDS 179 (91/88) 19204 8 60.06 (59.22-60.92) 2.40 Self-inflicted injuries (suicide) 137 (77/60) 16235 6.8 50.78 (50-51.57) 2.03 Interpersonal violence & other intentional injuries 120 (107/13) 15242 6.4 47.67 (46.92-48.43) 1.91 Nephritis and nephrosis 109 (49/60) 12688 5.3 39.68 (39-40.38) 1.59 Diarrhoeal diseases 82 (43/39) 9933 4.2 31.07 (30.46-31.69) 1.24 Other unintentional injuries 81 (57/24) 10091 4.2 31.56 (30.95-32.18) 1.26 Road traffic accidents 78 (53/25) 7455 3.1 23.32 (22.8-23.86) 0.93 Falls 65 (43/22) 7397 3.1 23.14 (22.62-23.67) 0.93 Maternal conditions 62 (0/62) 8518 3.6 26.64 (26.08-27.21) 1.07 Acute respiratory infections 55 (22/33) 6318 2.6 19.76 (19.28-20.25) 0.79 Meningitis/encephalitis 50 (30/20) 5776 2.4 18.07 (17.61-18.54) 0.72 Liver and alcohol related diseases 37 (22/15) 4007 1.7 12.53 (12.15-12.92) 0.50 Asthma & Chronic obstructive pulmonary disease 31 (18/13) 3641 1.5 11.39 (11.03-11.77) 0.46 Epilepsy 23 (12/11) 2529 1.1 7.91 (7.61-8.22) 0.32 Other infectious conditions 22 (14/8) 2510 1.1 7.85 (7.55-8.16) 0.31 Other neuropsychiatric disorders 19 (15/4) 2541 1.1 7.95 (7.65-8.27) 0.32 Gastro-oesophageal 18 (9/9) 1518 0.6 4.75 (4.52-5) 0.19 Other digestive diseases 18 (13/5) 2460 1 7.69 (7.39-8) 0.31 Diabetes mellitus 14 (10/4) 1694 0.7 5.3 (5.05-5.56) 0.21 Other non-communicable diseases 14 (6/8) 1809 0.8 5.66 (5.41-5.93) 0.23 Hepatitis 12 (7/5) 1330 0.6 4.16 (3.94-4.39) 0.17 Malaria 11 (7/4) 1283 0.5 4.01 (3.8-4.24) 0.16 Other Ill-defined and abnormal findings 26 (14/12) 2984 1.2 9.33 (9-9.67) 0.37 All 30-69 years deaths 2104 (1107/997) 239047 100 747.67 (744.68-750.67) 29.91
Results( (Leading causes of death: tuberculosis ) Overall, tuberculosis was the leading cause of death representing 8.5% of all deaths. It was among the top ten leading cause for 1-59 month, and 5 to 14 years age groups. For the 15-29 years and 30-69 years age groups, tuberculosis was among the top five causes of death. Age specific mortality rates for tuberculosis capture this evidence in a J-shaped curve (figure 2). The mortality rates increased significantly, for adults aged 45 to 59 years and rose steeply for older adults in the 60 to 69 year age range with similar rates of mortality for both males and females at all age groups. The risk of death from tuberculosis for age group 60-69 year was 2.8%.
Results(Leading causes of death: suicide) Excluding children under age 5 years, suicide (self-inflicted injury) was the second leading cause of death accounting for about 7.5% of all deaths. The age specific mortality curve for suicide shows mortality rates were lowest among children aged 5-14 years with peaks among young adults (15-29 years) for whom suicide was the leading cause of death. The mortality rates decreased for age group 30-44 years before rising for adults aged 45- 59 years and increasing further for those aged 60-69 years (Figure 3). The risk of death from suicide for age group 15-29 and 60-69 years were 0.8% and 0.9% separately. Deaths attributed to suicide were highest among older adults and among males than females.
Compare Ethiopia estimates with WHO estimates of cause-specific mortality Ethiopia total deaths (%) 575566 (100) WHO adjusted total deaths (%) 575566 (100) Cause of death All Causes I. Communicable, maternal, perinatal, & nutritional Tuberculosis Sexually-transmitted infections Diarrhoea Meningitis/encephalitis Malaria Respiratory infections Other infectious and parasitic Maternal Perinatal Nutritional II. Non-communicable Cancers Diabetes, endocrine, and immune Epilepsy Rheumatic heart Stroke Ischemic heart Chronic respiratory Other digestive Renal failure Congenital anomalies III. Injuries Road traffic accidents Falls Drowning Venomous deaths Suicide Interpersonal violence Mortality estimates for Ethiopia s VERA were compared with estimates from WHO cause specific mortality. We found comparable proportions between WHO and VERA estimates except for some categories where estimates diverged. The WHO underestimated the proportion of deaths attributable to injuries. Suicides estimates for Ethiopia VERA (36 306) were six times the estimate from WHO GHE (5909). Likewise, the WHO estimates were lower for interpersonal violence with only 1.7% of deaths attributed to this cause compared to 4.3% in the VERA records. Sexually transmitted infections estimates were twice that from WHO with 28 431 (4.9%) from VERA compared to 16 710 (2.9%). 285312 (49.6) 38874 (6.8) 28431 (4.9) 29337 (5.1) 17358 (3) 3234 (0.6) 55353 (9.6) 22603 (3.9) 10946 (1.9) 69922 (12.1) 3398 (0.6) 142133 (24.7) 42820 (7.4) 4315 (0.7) 6828 (1.2) 286 (0) 13994 (2.4) 29407 (5.1) 4366 (0.8) 5364 (0.9) 17425 (3) 4050 (0.7) 138708 (24.1) 21252 (3.7) 18509 (3.2) 10444 (1.8) 878 (0.2) 36306 (6.3) 24600 (4.3) 306158 (53.2) 25760 (4.5) 16710 (2.9) 39842 (6.9) 13554 (2.4) 6710 (1.2) 53157 (9.2) 28206 (4.9) 11326 (2) 101109 (17.6) 8181 (1.4) 190613 (33.1) 52181 (9.1) 11083 (1.9) 1657 (0.3) 1085 (0.2) 19861 (3.5) 18503 (3.2) 9131 (1.6) 2150 (0.4) 6945 (1.2) 19931 (3.5) 78793 (13.7) 32830 (5.7) 2682 (0.5) 3752 (0.7) 4030 (0.7) 5909 (1) 9872 (1.7)
Added value of this study Our study documented causes of death in all districts of the East Gojjam Zone recorded by the regional vital events registration agency. We assessed the systems accuracy and coverage with a complementary enumeration of deaths in neighboring households to the index deaths. The study identified causes of death for all age groups and highlighted suicide and tuberculosis as the leading causes of death particularly for young and middle aged adults. The national causes of death distribution were comparable to other model estimates except for diverging counts on injury related deaths.
Implications of the key findings The study provides evidence to support the need and feasibility of a national cost-effective mortality survey based on the census frame in Ethiopia. We identified key priorities for action by the government to reduce premature mortality for all age groups in Ethiopia.


")
")

")
")
")
")
")


")
")


")
")
")