Analyzing SAT Mathematics and Critical Reading Scores
This content covers a regression analysis between SAT Mathematics and Critical Reading scores, including calculating the regression line, predicting scores, identifying outliers, interpreting residuals, slopes, and y-intercepts, and assessing the relationship between exercise habits and fast-food consumption based on a scatterplot analysis.

Download Presentation

Please find below an Image/Link to download the presentation.
The content on the website is provided AS IS for your information and personal use only. It may not be sold, licensed, or shared on other websites without obtaining consent from the author. Download presentation by click this link. If you encounter any issues during the download, it is possible that the publisher has removed the file from their server.
E N D
Presentation Transcript
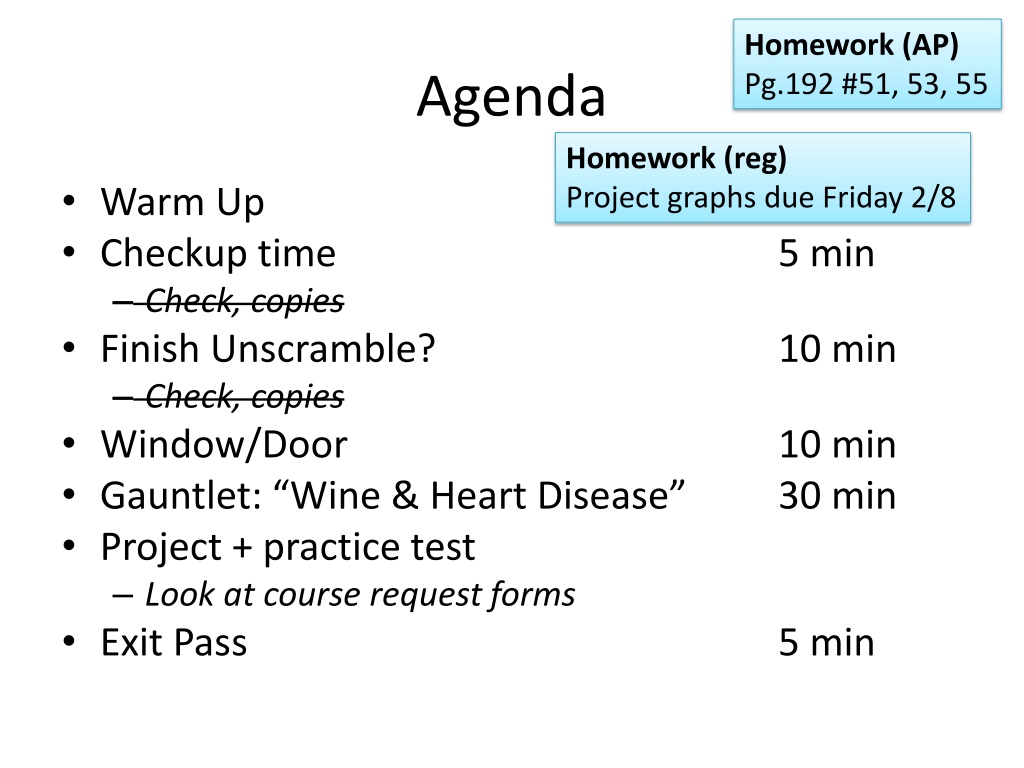
Homework (AP) Pg.192 #51, 53, 55 Agenda Homework (reg) Project graphs due Friday 2/8 Warm Up Checkup time Check, copies Finish Unscramble? Check, copies Window/Door Gauntlet: Wine & Heart Disease Project + practice test Look at course request forms Exit Pass 10 min 5 min 10 min 10 min 30 min 5 min
Warm Up Math Critical Reading 370 550 520 450 570 520 540 520 540 610 540 Can an SAT Mathematics score be used to predict an SAT Critical Reading score? 1. Use your calculator to calculate the equation of the regression line. 430 550 520 550 540 510 510 490 620 350 410 2. I scored a 740 on the Math portion. Predict my Critical Reading score. 3. Let s say my actual Critical Reading score was 720. What is the residual of my Critical Reading score? 4. Briefly interpret your slope and y- intercept (from #2) in context.
Warm Up ANSWERS Can an SAT Mathematics score be used to predict an SAT Critical Reading score? 1. Three outliers at 370, 450, 610. After deleting, y = 0.7791x + 100 Math Critical Reading 370 550 520 450 570 520 540 520 540 610 540 430 550 520 550 540 510 510 490 620 350 410 2. I scored a 740 on the Math portion. Predict my Critical Reading score. 676.534 3. Let s say my actual Critical Reading score was 720. What is the residual of my Critical Reading score? 720 676.534 = 43.466 4. Briefly interpret your slope and y- intercept (from #2) in context.
Unscramble Game (P.2) Groups of 4. Dry erase marker & whiteboard. I will give your group a problem. When everyone in your group has done the problem (with work shown), raise your hands. Each problem has a letter on the back. Unscramble all the letters to answer: What was I doing when I first saw my wife? +5 extra credit to the winning group.
Exercise 0 0 1 3 3 3 3 4 4 4 5 5 5 5 7 7 7 7 7 7 7 7 Fast food 14 18 2 2 47 0 7 2 0 2 14 0 2 0 7 10 1 1 14 0 1 2 Window/Door On our 1st day, I asked you how many days in a typical week you exercise, and I asked you how many days it d been since you ate fast food. Can you predict fast-food habits with exercise habits? 1. 2. 3. 4. 5. Comment on the scatterplot. Interpret the coefficient of determination. Summarize what the slope means. Summarize what the y-intercept means. Let s say you exercise 3 days in a typical week, and it s been 5 days since you ate fast food. Calculate your residual. Let s say you exercise 5 days in a typical week, and the residual of your eating habits is -2.45. How many days has it been since you ate fast food? 6.
Exercise 0 0 1 3 3 3 3 4 4 4 5 5 5 5 7 7 7 7 7 7 7 7 Fast food 14 18 2 2 47 0 7 2 0 2 14 0 2 0 7 10 1 1 14 0 1 2 Window/Door On our 1st day, I asked you how many days in a typical week you exercise, and I asked you how many days it d been since you ate fast food. Can you predict fast-food habits with exercise habits? r = -0.3121 r2 = 0.0974 y = -0.77x + 8.3
GAUNTLET: Wine & Heart Disease Groups of 3-4. Elect a Writer to do the worksheet. After each problem (#1, #2, #3, #4, #5), show me. Thumb Up Flawless. Thumb Down At least one flaw. You get 1 point. You get 1 Free Pass and 1 Pointer. Both can only be used in response to a mistake. Winner = Group with least points. In case of tie, Winner = finished first.
Country Alcohol from wine (liters/year) 2.5 3.9 2.9 2.4 2.9 0.8 9.1 2.7 0.8 0.7 7.9 1.8 1.9 0.8 6.5 1.6 5.8 1.3 1.2 Heart disease deaths (per 100,000) 211 167 131 191 220 297 71 172 211 300 107 167 266 227 86 207 115 285 199 Australia Austria Belgium Canada Denmark Finland France Germany Iceland Ireland Italy Netherlands New Zealand Norway Spain Sweden Switzerland United Kingdom United States
Wrong (forgot to check for outliers) y = -22.97x + 260.56 r = -0.8428 r2 = 0.7103
Correct y = -24.64x + 263.99 r = -0.8095 r2 = 0.6553
Course Request sheets Counselors available both lunches today, tomorrow. Important links: Department summaries tinyurl.com/RCHS-catalog-summary Full course descriptions tinyurl.com/RCHS-catalog-2020 A-G catalog tinyurl.com/RCHS-A-G-2020 Make sure to: 1. Sign, and get your parent to sign. 2. Read prerequisites. 3. Choose backups carefully. Don t leave them blank. Bring to class TODAY, so I can check it. Due to your period 2 teacher this Friday 2/7.
Study Hall 1. Work on your Project #2. 2. Work on your practice test. 3. I ll be looking at your Course Request forms.
Homework (AP) Pg.192 #51, 53, 55 Exit Pass Homework (reg) Project graphs due Friday 2/8 The regression equation y = 41.35 + 3.11x predicts a student s height (y) based on their handspan (x). 1. Mr. Colligan s handspan is 8.5 inches. Predict his height. 2. Mr. Colligan s actual height is 75 inches. What is the value of his residual?
")


")


")


")