Unpredictable Arctic Monitoring Framework for Extreme Event Integration
This project focuses on integrating extreme event monitoring into existing biodiversity monitoring efforts in the Arctic. The task involves developing a monitoring framework, identifying types of extreme events, and monitoring variables aligned with biodiversity plans. The review paper discusses the spatial and temporal scales of extreme events, highlighting various types such as erosion, precipitation extremes, and disease outbreaks. The monitoring framework emphasizes detecting extreme events, assessing their impact on ecosystems, and planning for continuous monitoring to gather baseline data, adaptively adjusting observations when needed, and analyzing impacts post-event.
Download Presentation

Please find below an Image/Link to download the presentation.
The content on the website is provided AS IS for your information and personal use only. It may not be sold, licensed, or shared on other websites without obtaining consent from the author.If you encounter any issues during the download, it is possible that the publisher has removed the file from their server.
You are allowed to download the files provided on this website for personal or commercial use, subject to the condition that they are used lawfully. All files are the property of their respective owners.
The content on the website is provided AS IS for your information and personal use only. It may not be sold, licensed, or shared on other websites without obtaining consent from the author.
E N D
Presentation Transcript
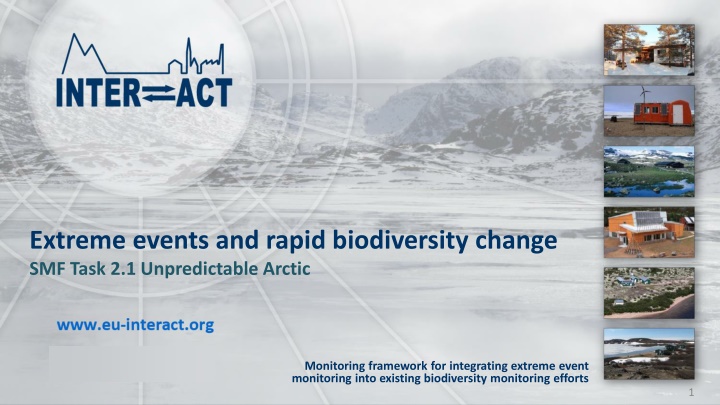
Extreme events and rapid biodiversity change SMF Task 2.1 Unpredictable Arctic Monitoring framework for integrating extreme event monitoring into existing biodiversity monitoring efforts 1
Task 2.1 Unpredictable Arctic Monitoring extreme events and rapid biodiversity change - Test implementation at INTERACT stations Developed jointly by INTERACT and CAFF/CBMP (WP4) Process - Identify relevant types of extreme events - Develop monitoring framework - Identify extreme event variables and Focal Ecosystem Components to monitor in line with CBMP monitoring plans Comments, concerns, improvements are welcomed 2
Extreme events and rapid biodiversity change Review paper on studies of extreme events in the Arctic (van Beest et al 2022) and input from INTERACT test stations Spatial scale of extreme event Medium scale (Landscape, < 100 km2) Precipitation extremes Errosion Small scale (Local, < 1 km2) Landslide Errosion Large scale (Regional, > 100 km2) Precipitation extremes https://www.frontiersin.org/articles/1 0.3389/fenvs.2022.983637/full Short (< day) Temporal scale of extreme event GLOF Fire Precipitation extremes Fire Icing events Errosion Population outbreak Desease outbreak Precipitation extremes Temperature extremes Icing events Vulcano eruption Extreme ice/snow cover Temperature extremes Desease outbreak Brief (< month) Errosion Population outbreak Desease outbreak Medium (< year) Flooding Temperature extremes Long (> years) 3
Extreme events and rapid biodiversity change - Monitoring framework Extreme event monitoring Ecosystem impact monitoring Identify extreme events and their impacts to monitor at station See types of extreme events and guidelines for monitoring (link) events and their ecosystem impacts Planning for monitoring extreme Planning and monitoring to detect extreme events and gather baseline data Develop extreme event monitoring - Identify variables/methods to detect if an extreme event occurs. - Identify variables/methods to monitor the extreme event itself if it occurs. Develop extreme event impact monitoring - Identify baseline FECs/methods to monitor the impact of the extreme event (during and after extreme event). - Identify additional FECs/methods to monitor impacts of the extreme event if it occurs. Integrate in field station monitoring plan Continuous monitoring Extreme event detection monitoring Baseline FEC monitoring Extreme event occurs Extreme event detected Monitor the extreme event itself - Initiate monitoring of the extreme event itself. - Use adaptive monitoring approach, i.e. adapt frequency of observations to changes in extreme event variables. - Terminate monitoring when extreme event variable(s) return to normal (average) values or new stady state. Gather baseline FEC data - Continue baseline monitoring during and after the extreme event. - Gather data for analysis when needed for impact analysis. Gather data for final analysis when the FEC has returned to normal (average) values or a new steady state. Monitor impact of the extreme event (in addition to potential baseline monitoring) - Initiate monitoring of relevant FECs. - Use adaptive monitoring approach, i.e. adapt frequency of observations to changes in FECs. - Terminate monitoring when FEC variable(s) return to normal (average) values or new steady state. Monitoring extreme events as they occur and their effects on ecosystems upon detection of extreme event Monitoring initiated Analysis - Part of adaptive monitotring approach - Analysis when extreme event and impacts have returned to normal (average) values or a new steady state. Data submission/Reporting 4
Extreme event monitoring Ecosystem impact monitoring Identify extreme events and their impacts to monitor at station See types of extreme events and guidelines for monitoring (link) events and their ecosystem impacts Planning for monitoring extreme Develop extreme event monitoring - Identify variables/methods to detect if an extreme event occurs. - Identify variables/methods to monitor the extreme event itself if it occurs. Develop extreme event impact monitoring - Identify baseline FECs/methods to monitor the impact of the extreme event (during and after extreme event). - Identify additional FECs/methods to monitor impacts of the extreme event if it occurs. Integrate in field station monitoring plan Continuous monitoring Extreme event detection monitoring Baseline FEC monitoring Ecosystem impact monitoring: Veg. change Example: Extreme event monitoring Avalanche Baseline data needed: Vegetation plot species composition New monitoring: vegetation plot in avalanche zone Detection: visiual observation of mountain sides Monitor/assess extreme event: affected area/volume of snow 5
Extreme event detected Extreme event detected Example Initiate assessment of affected area/snow volume Initiate vegetation plot in affected area Avalanche Extreme event occurs Extreme event detected Monitor the extreme event itself - Initiate monitoring of the extreme event itself. - Use adaptive monitoring approach, i.e. adapt frequency of observations to changes in extreme event variables. - Terminate monitoring when extreme event variable(s) return to normal (average) values or new stady state. Gather baseline FEC data - Continue baseline monitoring during and after the extreme event. - Gather data for analysis when needed for impact analysis. Gather data for final analysis when the FEC has returned to normal (average) values or a new steady state. Monitor impact of the extreme event (in addition to potential baseline monitoring) - Initiate monitoring of relevant FECs. - Use adaptive monitoring approach, i.e. adapt frequency of observations to changes in FECs. - Terminate monitoring when FEC variable(s) return to normal (average) values or new steady state. upon detection of extreme event Monitoring initiated Analysis - Part of adaptive monitotring approach - Analysis when extreme event and impacts have returned to normal (average) values or a new steady state. 6 Data submission/Reporting
Extreme events and rapid biodiversity change - Monitoring framework Extreme event monitoring Ecosystem impact monitoring Identify extreme events and their impacts to monitor at station See types of extreme events and guidelines for monitoring (link) events and their ecosystem impacts Planning for monitoring extreme Planning and monitoring to detect extreme events and gather baseline data Develop extreme event monitoring - Identify variables/methods to detect if an extreme event occurs. - Identify variables/methods to monitor the extreme event itself if it occurs. Develop extreme event impact monitoring - Identify baseline FECs/methods to monitor the impact of the extreme event (during and after extreme event). - Identify additional FECs/methods to monitor impacts of the extreme event if it occurs. Integrate in field station monitoring plan Continuous monitoring Extreme event detection monitoring Baseline FEC monitoring Extreme event occurs Extreme event detected Monitor the extreme event itself - Initiate monitoring of the extreme event itself. - Use adaptive monitoring approach, i.e. adapt frequency of observations to changes in extreme event variables. - Terminate monitoring when extreme event variable(s) return to normal (average) values or new stady state. Gather baseline FEC data - Continue baseline monitoring during and after the extreme event. - Gather data for analysis when needed for impact analysis. Gather data for final analysis when the FEC has returned to normal (average) values or a new steady state. Monitor impact of the extreme event (in addition to potential baseline monitoring) - Initiate monitoring of relevant FECs. - Use adaptive monitoring approach, i.e. adapt frequency of observations to changes in FECs. - Terminate monitoring when FEC variable(s) return to normal (average) values or new steady state. Monitoring extreme events as they occur and their effects on ecosystems upon detection of extreme event Monitoring initiated Analysis - Part of adaptive monitotring approach - Analysis when extreme event and impacts have returned to normal (average) values or a new steady state. Data submission/Reporting 7
Extreme events Temperature extremes Derived extreme events Impact Species survival Phenology Energy and Carbon fluxes Destruction of riverbanks/habitats Food availability Habitat destruction Extreme events and rapid biodiversity change Melting permafrost Glacier Lake Outburst Flood (GLOF) Thaw/freeze events Weathering of rocks Rain in megative temperatures Icing events Precipitaion extremes Low precipitation (drought) High precipitaion (extreme run-off) Flooding Species survival Permafrost dynamics Energy and Carbon fluxes Destruction of riverbanks/habitats Destruction of habitat Landslides Slush flow avalanches Melting permafrost BREAK-OUT Extreme ice/snow cover Thickness Spatial coverage Temporal coverage Storms, extreme wave heights Productivity Species survival Phenology Snow avalanches Hydrology Flooding Errosion Permafrost degradation Lightening Human caused fires Destruction of habitat Fire Destruction of habitat Vulcano erruption Population outbreaks Population dynamics Physical climate chareacteristics Invasive species Species survival Species survival Decease outbreaks
Extreme events monitoring guidance Description of extreme event Detecting and monitoring the extreme event itself Monitoring ecosystem impacts of the extreme event References/links Expected temporal scale of extreme event itself Expected spatial scale of extreme event itself Types of impact (and relevant cascading effects) Define extreme event - Suggested definition Method to detect extreme event Method to monitor (risk of) extreme event itself (if different from detection method) Suggested baseline data needed to assess impact on ecosystem/biodiversity (if any)* Suggested method to monitor impacts of extreme event (if different from or baseline data are missing) Expected temporal scale of impact Precipitaion extremes Low precipitation (drought) Medium (< year) Large scale (Regional, > 100 km2) Impact on terrestrial ecosystem - coverage/abundance, survival and reproduction of flora and fauna from suboptimal conditions The lowest 2% of seasonal rainfall totals or less than expected from trend analyses Precipitation measurements Diversity, abundance, composition, productivity, phenology, spatial structure, ecosystem functions and processes, demographics, temporal cycles and health for flora and fauna Monitor in affected and comparable reference area < 5 years https://www.climate.gov/news-features/understanding- climate/extreme-event-attribution-climate-versus- weather-blame-game High precipitation (flooding) Brief (< month) Medium (Several catchments/ < 10 km2) Impact on terrestrial ecosystem - coverage/abundance, survival and reproduction of flora and fauna from suboptimal conditions from loss of substratum, flush and drowning Days with precipitation in the top 1 percent of all days with precipitation or more than expected from trend analyses Precipitation measurements Water level measurements Remote sensing or field measurements of affected area (size of area) Diversity, abundance, composition, productivity, phenology, spatial structure, ecosystem functions and processes, phenology, demographics, temporal cycles and health for flora and fauna Monitor in affected and comparable reference area < 5 years https://www.globalchange.gov/browse/indicators/heavy- precipitation Temperature Heat waves Brief (< month) Large (region/ > 10 km2) Impact on terrestrial ecosystem - coverage/abundance, survival and reproduction of flora and fauna from suboptimal conditions Daily temperatures > 10 C above high average or more than expected from trend analyses Air temperature measurements Diversity, abundance, composition, productivity, phenology, spatial structure, ecosystem functions and processes, phenology, demographics, temporal cycles and health for flora and fauna Diversity, abundance, composition, productivity, phenology, spatial structure, ecosystem functions and processes, phenology, demographics, temporal cycles and health for flora and fauna < 5 years https://www.un-spider.org/extreme-temperature Cold Brief (< month) Large (region/ > 10 km2) Impact on terrestrial ecosystem - coverage/abundance, survival and reproduction of flora and fauna from suboptimal conditions Temperatures of - 55 C, including wind chill, issues extreme cold warning or less than expected from trend analyses Air temperature measurements < 5 years https://en.wikipedia.org/wiki/Extreme_cold_warning Extreme ice/snow cover Thickness Kunkel, K.E., Robinson, D.A., Champion, S. et al. Trends and Extremes in Northern Hemisphere Snow Characteristics. Curr Clim Change Rep2, 65 73 (2016). https://doi.org/10.1007/s40641-016-0036-8 Bokhorst, S., Pedersen, S.H., Brucker, L. et al. Changing Arctic snow cover: A review of recent developments and assessment of future needs for observations, modelling, and impacts. Ambio 45, 516 537 (2016). https://doi.org/10.1007/s13280-016-0770-0, https://link.springer.com/article/10.1007/s13280-016- 0770-0 Brief (< month) Large (region/ > 10 km2) Delay of snow melt and uncover of vegetation, decreases availability of feed for higher trophic levels and higher risk of mismatch Snow cover thickness less than 2 % of the long-term average or significantly more than expected from trend analyses Weekly measurements of snow cover thickness Diversity, abundance, composition, productivity, phenology, spatial structure, ecosystem functions and processes, phenology, demographics, temporal cycles and health for flora and fauna Monitor in affected and comparable reference area < 1 year Spatial coverage Medium (< year) Large (region/ > 10 km2) Larger area, with potential decerased availablity of feed for higher trophic levels Area with snow cover within normal thickness range changed by more than 1 % of normal area or significantly more than expected from trend analyses Weekly measurements of snow cover thickness combined with satelite information on spatial range Diversity, abundance, composition, productivity, phenology, spatial structure, ecosystem functions and processes, phenology, demographics, temporal cycles and health for flora and fauna Diversity, abundance, composition, productivity, phenology, spatial structure, ecosystem functions and processes, phenology, demographics, temporal cycles and health for flora and fauna Monitor in affected and comparable reference area < 1 year https://www.epa.gov/climate-indicators/snow-ice Temporal coverage Medium (< year) Large (region/ > 10 km2) Delay in uncover of vegetation, decreases productivity, availability of feed for higher trophic levels and higher risk of mismatch Season with snow cover within normal thickness range changed by more than 2 weeks or significantly more than expected from trend analyses Weekly measurements of snow cover thickness Monitor in affected and comparable reference area < 1 year https://www.epa.gov/climate-indicators/snow-ice 9
GLOF (glacier-lake-outburst-flood) Short (< day) Medium (Several catchments/ < 10 km2) Impact on terrain, land organisms, their productivity, biodiversity and habitat composition by loss of substratum, flush and drowning Flooding from outburst of a glacier lake Air temperature measurements, satelite observations on glacier retreat and glacier lake size or water level measurements. Observation of outburst flood Remote sensing or field measurements of affected area (size of area) Diversity, abundance, composition, productivity, phenology, spatial structure, ecosystem functions and processes, phenology, demographics, temporal cycles and health for flora and fauna Monitor in affected and comparable reference area >5 years Icing events Icing Brief (< month) Large (region/ > 10 km2) Impact ability of herbivores to reach food source under snow. Affect reproduction and population size. Changes in herbivore population may affect predator populations and plant community composition Impact ability of herbivores to reach food source under snow. Affect reproduction and population size. Changes in herbivore population may affect predator populations and plant community composition Plant species composition, potential long-term vegetation shifts with climate change Formation of ice layer in vegetation or on snow > 10 mm Observations of precipitation type and temperature Snow structure measurements Diversity, abundance, composition, productivity, phenology, spatial structure, ecosystem functions and processes, phenology, demographics, temporal cycles and health for flora and fauna Diversity, abundance, composition, productivity, phenology, spatial structure, ecosystem functions and processes, phenology, demographics, temporal cycles and health for flora and fauna Diversity, abundance, composition, productivity, phenology, spatial structure, ecosystem functions and processes, phenology, demographics, temporal cycles and health for flora and fauna Diversity, abundance, composition, productivity, phenology, spatial structure, ecosystem functions and processes, phenology, demographics, temporal cycles and health for terrestrial and coastal flora and fauna Monitor in affected and comparable reference area < 5 years Berger, J., Hartway, C., Gruzdev, A. et al. Climate Degradation and Extreme Icing Events Constrain Life in Cold-Adapted Mammals. Sci Rep 8, 1156 (2018). https://doi.org/10.1038/s41598-018-19416-9 ROS (rain -on-snow) Short (< day) Large (region/ > 10 km2) Defined as a minimum of 3 mm of rain falling on a minimum of 5 mm of snow water equivalent Preferredably dayly measurements of (type of) precipitation and snow layer thickness Monitor in affected and comparable reference area < 1 year Rennert, K. J., Roe, G., Putkonen, J., & Bitz, C. M. (2009). Soil Thermal and Ecological Impacts of Rain on Snow Events in the Circumpolar Arctic, Journal of Climate, 22(9), 2302-2315. Retrieved Jun 24, 2022, from https://journals.ametsoc.org/view/journals/clim/22/9/200 8jcli2117.1.xml Landslides Short (< day) Medium (Several catchments/ < 10 km2) Rapid downward movement of soil/gravel/rocks down a sloped section of land under the influence of gravity Annual remote sensing or ad hoc field observation of landslide prone areas Remote sensing or field measurements of affected area (size of area). Drone identification of matter movement compared to baseline Monitor in affected and comparable reference area >5 years Errosion Short (< day) Large (region/ > 10 km2) Remove land, and with it, habitats, and its productivity, biodiversity and composition, that may be terrestrial as well as coastal. If errosion leads to flooding by sea, it may cause damage to coastal habitats and (short-term) change in salinity at land, which also may add to the impact on habitats Removal of sand/soil/gravel Annual remote sensing or ad hoc field observation of errosion prone areas Remote sensing or field measurements of affected area (size of area) or loss of area (e.g., coastline). Monitor in affected and comparable reference area >5 years T. Jones, D. McLennan, C. Behe, M. Arvnes, S. Wegeberg, L. Sergienko, C. Harris, Q. Harcharek, T. Christensen (2019). Arctic Coastal Biodiversity Monitoring Plan. Conservation of Arctic Flora and Fauna International Secretariat: Akureyri, Iceland. ISBN 978-9935-431-76-9 Fire Brief (< month) Medium (Several catchments/ < 10 km2) Burn down of vegetation, and loss of fauna from fire and burn down of habitat, loss of feed Vegetation or underlying turf has caught fire, observation of flames (open fire) or flameless combustion/smoulder from smoke or heat Alarm, remote sensing or ad hoc field observations of fire or smoke Remote sensing or field mesaurements of affected area (size of area) Diversity, abundance, composition, productivity, phenology, spatial structure, ecosystem functions and processes, phenology, demographics, temporal cycles and health for flora and fauna Monitor in affected and comparable reference area >5 years Population outbreaks Brief (< month) Medium (Several catchments/ < 10 km2) Larvae outbreaks may lead to canopy defoliation, decreased vegetation biomass, shifts in vegetation composition, decreased C uptake and cascading impacts through other food web compartments. Rodent outbreaks may lead to high pressure on vegetation sudden increases in abundance of a particular species over a short period of time. Abundance > 200 % of normal or significantly higher than obtained from trend analyses Monitoring of fauna including focus on species known to have potential outbreaks Systematic sampling and counting Diversity, abundance, composition, Monitor in affected and comparable reference area < 5 years Lund, M., Raundrup, K., Westergaard-Nielsen, A. et al. Larval outbreaks in West Greenland: Instant and subsequent effects on tundra ecosystem productivity and CO2 exchange. Ambio 46, 26 38 (2017). https://doi.org/10.1007/s13280-016-0863-9 Andreassen, H.P., Sundell, J., Ecke, F. et al. Population cycles and outbreaks of small rodents: ten essential questions we still need to solve. Oecologia 195, 601 622 (2021). https://doi.org/10.1007/s00442-020-04810-w spatial structure, ecosystem functions and processes, phenology, demographics, temporal cycles and health and productivity for flora and insects Decease outbreaks Brief (< month) Medium (Several catchments/ < 10 km2) Decease outbreaks may lead to loss of host and hence food availablity on higher trophic level Detection of decease Monitoring of fungi and microbiology including focus on pathogenic organisms Systematic sampling and counting Diversity, abundance, spatial Monitor in affected and comparable reference area < 5 years structure, ecosystem functions and processes, phenology, demographics for decomposers 10
Abiotic parameters how to monitor extreme events themselves Arctic Passion recommends methods to monitor essential variables - 10 INTERACT stations involved through INPA Western Arctic Research Centre (WARC) CEN Churchill Northern Studies Centre (CNSC) Kevo Subarctic Research Station CNR Arctic Station Dirigibile Italia NiBio Svanhovd research station Whapmago ostui- Kuujjuarapi k Station Zackenberg Research Station Toolik Field Station Arctic Station Rif Field Station Category Meteorology Meteorology Meteorology Meteorology Meteorology Meteorology Energy balance and radiation Energy balance and radiation Energy balance and radiation Energy balance and radiation Energy balance and radiation Energy balance and radiation Energy balance and radiation Energy balance and radiation Energy balance and radiation Cryosphere Sub surface characteristics Cryosphere Sub surface characteristics Cryosphere Sub surface characteristics Cryosphere Sub surface characteristics Cryosphere Snow characteristics Cryosphere Snow characteristics Cryosphere Snow characteristics Parameter Air temperature Air humidity Air pressure Wind velocity Wind direction Precipitation Short Wave incoming Short wave outgoing Long wave incoming Long wave outgoing Net radiation UV-B Sensible heat flux Latent heat flux Soil Heat flux Ground surface temperature Soil temperature Active layer depth Permafrost temperature Snow depth Snow density Snow temperature Climate Climate Climate Climate Climate Climate Climate Climate Climate Climate Climate Climate Climate Climate Climate YES YES YES YES YES YES NO NO NO NO NO NO NO NO NO YES YES YES YES YES NO NO YES YES YES YES YES YES YES YES NO NO YES YES NO NO NO YES YES YES YES YES YES YES YES YES YES YES YES YES YES YES YES YES YES YES NO NO NO YES YES NO NO YES NO NO YES YES YES YES YES YES YES YES YES YES YES YES YES YES YES YES YES YES NO YES YES YES YES YES YES YES YES YES YES YES YES YES YES YES YES YES YES YES YES YES YES YES YES YES YES YES YES YES YES YES NO NO NO NO YES NO NO NO YES YES YES YES YES YES NO NO YES YES YES YES YES NO YES YES YES YES YES YES NO NO NO YES YES YES YES YES NO NO YES YES YES YES YES YES NO NO NO NO NO NO NO NO NO NO YES NO NO NO NO NO YES YES YES YES YES YES YES NO NO NO NO NO NO NO NO NO YES NO NO NO NO NO NO NO NO NO NO NO NO NO NO NO NO NO NO NO NO NO NO NO NO NO NO NO 11
Biotic parameters How to? 12
Comments, concerns, improvements? BREAK-OUT 14
NEXT STEPS Finalising documents Interactive guidance tool Further consultation in CAFF/CBMP Test implementation 2023 at INTERACT stations Integrate in CBMP online tools 15
