Understanding Arctic Cyclones and Their Impact on Weather Forecasting
The Arctic environment is undergoing rapid changes, and Arctic cyclones (ACs) play a crucial role in influencing weather patterns in the region. This study explores the intensity and position root mean square error (RMSE) of ACs during different skill periods, highlighting significant differences and the impact on weather forecast accuracy. By investigating the characteristics and behaviors of ACs, this research aims to enhance our understanding of their evolution and forecast skill, providing valuable insights for improved weather predictions in the Arctic region.
Download Presentation

Please find below an Image/Link to download the presentation.
The content on the website is provided AS IS for your information and personal use only. It may not be sold, licensed, or shared on other websites without obtaining consent from the author. Download presentation by click this link. If you encounter any issues during the download, it is possible that the publisher has removed the file from their server.
E N D
Presentation Transcript
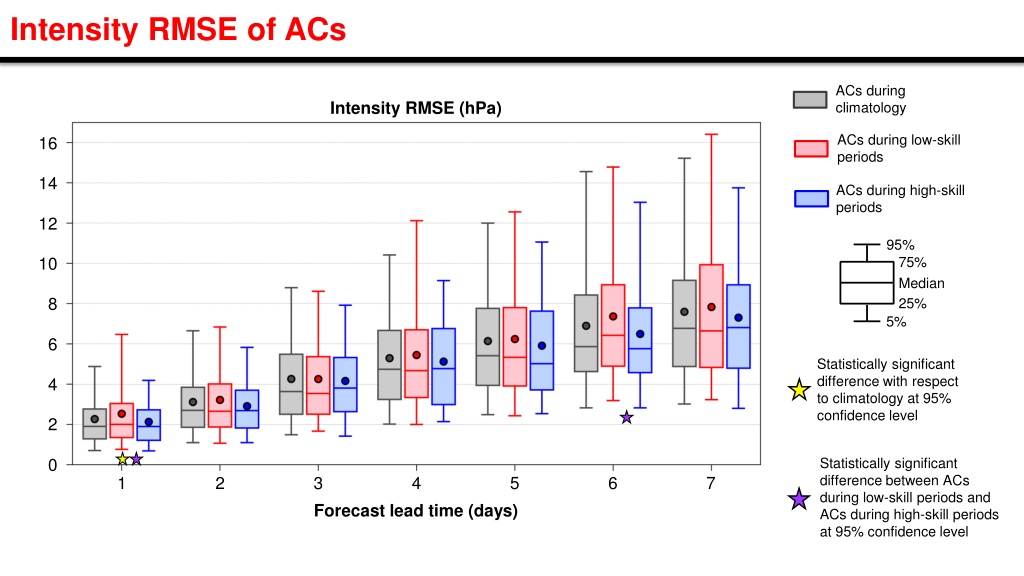
Intensity RMSE of ACs ACs during climatology Intensity RMSE (hPa) ACs during low-skill periods 16 14 ACs during high-skill periods 12 95% 75% Median 10 8 25% 5% 6 Statistically significant difference with respect to climatology at 95% confidence level 4 2 0 Statistically significant difference between ACs during low-skill periods and ACs during high-skill periods at 95% confidence level 1 2 3 Forecast lead time (days) 4 5 6 7
Position RMSE of ACs ACs during climatology Position RMSE (hPa) ACs during low-skill periods 1400 1200 ACs during high-skill periods 1000 95% 75% Median 800 25% 5% 600 400 200 0 1 2 3 Forecast lead time (days) 4 5 6 7
Motivation The Arctic environment is rapidly changing in response to enhanced near-surface warming relative to the rest of the globe, referred to as Arctic amplification, and diminishing sea ice (e.g., Stroeve et al. 2007; Screen and Simmonds 2010). As the Arctic environment rapidly changes, human activities, including shipping, tourism, and military operations, are increasing in the Arctic (e.g., Hall and Saarinen 2010; Melia et al. 2016, 2017; U.S. Department of the Navy 2021). Accurate weather prediction over the Arctic is important given that these human activities can be impacted by weather conditions in the Arctic. There has been a dearth of research concerning Arctic environmental conditions associated with periods of low and high forecast skill of the synoptic-scale flow over the Arctic, aside from a recent study by Yamagami and Matsueda (2021).
Motivation Arctic cyclones (ACs) are synoptic-scale surface cyclones that may originate within the Arctic or move into the Arctic from lower latitudes (e.g., Serreze 1995; Zhang et al. 2004; Serreze and Barrett 2008; Crawford and Serreze 2016). ACs occur most frequently during summer (e.g., Zhang et al. 2004; Serreze and Barrett 2008) and may play important roles in influencing Arctic environmental conditions and the forecast skill of the synoptic-scale flow over the Arctic (e.g., Yamagami and Matsueda 2021). ACs may be associated with strong surface winds and high waves (e.g., Zhang et al. 2013; Thomson and Rogers 2014), may transport warm, moist air into the Arctic (e.g., Messori et al. 2018; Fearon et al. 2021), and may contribute to rapid sea ice loss and rapid sea ice movement (e.g., Asplin et al. 2012; Zhang et al. 2013; Stern et al. 2020 ;Peng et al. 2021).
Motivation Previous studies that have examined features and processes influencing the evolution of ACs have primarily been conducted through case studies of selected ACs (e.g., Simmonds and Rudeva 2012; Tao et al. 2017a,b; Yamagami et al. 2017). There have been a limited number of studies that have examined features and processes influencing the forecast skill of ACs (e.g., Tao et al. 2017b; Yamagami et al. 2018a; Johnson and Wang 2021).
Objectives 1) Examine characteristics of the Arctic environment and the frequency, characteristics, and forecast skill of ACs during periods of low and high forecast skill of the synoptic-scale flow over the Arctic, hereafter referred to as low-skill periods and high-skill periods, respectively. 2) Examine features and processes influencing the evolution of strong low-skill ACs and strong high-skill ACs during low-skill periods. 3) Examine features and processes influencing the forecast skill of a selected strong AC associated with low forecast skill during a low-skill period.
Hypotheses 1) The Arctic environment tends to be characterized by greater synoptic-scale flow amplitude, greater baroclinic growth rates, and greater latent heating during low- skill periods compared to high-skill periods.
Hypotheses 1) The Arctic environment tends to be characterized by greater synoptic-scale flow amplitude, greater baroclinic growth rates, and greater latent heating during low- skill periods compared to high-skill periods. 2) ACs occur more frequently across the Arctic, tend to be stronger, tend to be embedded in more favorable dynamic and thermodynamic environments for development and intensification, and tend to be characterized by lower forecast skill during low-skill periods compared to high-skill periods.
Hypotheses 1) The Arctic environment tends to be characterized by greater synoptic-scale flow amplitude, greater baroclinic growth rates, and greater latent heating during low- skill periods compared to high-skill periods. 2) ACs occur more frequently across the Arctic, tend to be stronger, tend to be embedded in more favorable dynamic and thermodynamic environments for development and intensification, and tend to be characterized by lower forecast skill during low-skill periods compared to high-skill periods. 3) Low-skill ACs during low-skill periods tend to be stronger and tend to be embedded in more favorable dynamic and thermodynamic environments for development and intensification compared to high-skill ACs during low-skill periods. Similarly, low-skill ACs during high-skill periods tend to be stronger and tend to be embedded in more favorable dynamic and thermodynamic environments for development and intensification compared to high-skill ACs during high-skill periods.
Hypotheses 4) TPVs, baroclinic zones, and WCBs, and TPV AC interactions, baroclinic processes, and latent heating, influence the evolution of strong low-skill ACs during low-skill periods and strong high-skill ACs during low-skill periods, although these features and processes tend to be more robust for strong low-skill ACs during low-skill periods.
Hypotheses 4) TPVs, baroclinic zones, and WCBs, and TPV AC interactions, baroclinic processes, and latent heating, influence the evolution of strong low-skill ACs during low-skill periods and strong high-skill ACs during low-skill periods, although these features and processes tend to be more robust for strong low-skill ACs during low-skill periods. 5) Forecast errors in TPVs, baroclinic zones, and WCBs, and forecast errors in TPV AC interactions, baroclinic processes, and latent heating, contribute to forecast errors in strong low-skill ACs during low-skill periods.
Hypotheses 1) The Arctic environment tends to be characterized by greater synoptic-scale flow amplitude, greater baroclinic growth rates, and greater latent heating during low- skill periods compared to high-skill periods.
Hypotheses 2) ACs occur more frequently across the Arctic, tend to be stronger, tend to be embedded in more favorable dynamic and thermodynamic environments for development and intensification, and tend to be characterized by lower forecast skill during low-skill periods compared to high-skill periods.
Hypotheses 3) Low-skill ACs during low-skill periods tend to be stronger and tend to be embedded in more favorable dynamic and thermodynamic environments for development and intensification compared to high-skill ACs during low-skill periods. Similarly, low-skill ACs during high-skill periods tend to be stronger and tend to be embedded in more favorable dynamic and thermodynamic environments for development and intensification compared to high-skill ACs during high-skill periods.
Hypotheses 4) TPVs, baroclinic zones, and WCBs, and TPV AC interactions, baroclinic processes, and latent heating, influence the evolution of strong low-skill ACs during low-skill periods and strong high-skill ACs during low-skill periods, although these features and processes tend to be more robust for strong low-skill ACs during low-skill periods.
Hypotheses 5) Forecast errors in TPVs, baroclinic zones, and WCBs, and forecast errors in TPV AC interactions, baroclinic processes, and latent heating, contribute to forecast errors in strong low-skill ACs during low-skill periods.
Ensemble-based sensitivity analysis (ESA) Utilize ensemble-based sensitivity analysis (ESA) technique (e.g., Torn and Hakim 2008) to examine the sensitivity of the forecast skill of intensity and position of AC16 to selected dynamic and thermodynamic quantities at earlier forecast lead times. Calculate the sensitivity of a forecast metric of interest J to a model state variable xi at an earlier forecast lead time for an ensemble of size M via J and xi denote the 1 M ensemble estimates of the forecast metric and ith model state variable, respectively, cov denotes the covariance, and var denotes the variance (e.g., Torn and Hakim 2008).
Ensemble-based sensitivity analysis (ESA) Normalize the values of xiby the ensemble standard deviation of xi following Torn and Romine (2015), such that all sensitivities have units of the forecast metric per standard deviation of the model state variable. Determine sensitivity to be statistically significant at the 95% confidence level by following the methodology of Torn and Hakim (2008).
Data and Methods 0000 UTC 15 Aug (120 h) ERA5 min SLP (972.8 hPa) SLP within a 700-km radius circle surrounding the ERA5 position of AC16 at 0000 UTC 15 August (120 h) correlates relatively well with the intensity error and position error of AC16 at this time. Ensemble member min SLP (hPa): < 970 970 975 975 980 Use average SLP within the 700-km radius circle surrounding the ERA5 position of AC16 at 0000 UTC 15 August (120 h) as the forecast metric, which is hereafter referred to as JAC. 980 985 985 990 990 995 995 700-km radius circle surrounding ERA5 location of the AC
Interpreting sensitivity values All sensitivity values are multiplied by 1, such that a more accurate prediction of the intensity and position of AC16 at 0000 UTC 15 August (120 h) is associated with increasing the value of the model state variable at an earlier forecast lead time for positive sensitivity values and with decreasing the value of the model state variable at an earlier forecast lead time for negative sensitivity values.
Characteristics of the Arctic Environment and ACs Calculate selected dynamic and thermodynamic quantities to characterize the Arctic environment and ACs using ERA-Interim dataset at 1 horizontal resolution. The selected quantities are area-averaged over the Arctic ( 70 N) to characterize the Arctic environment. The selected quantities are area-averaged within a 1000-km radius from the center of each AC to characterize the environment in the vicinity of each AC. The most extreme value of the area-averaged quantities, and the lowest SLP, for each AC during a period of interest (i.e., climatology, low-skill periods, or high-skill periods) when located in the Arctic during the period of interest are determined.
Characteristics of the Arctic Environment and ACs The selected quantities that are area-averaged are: The absolute value of the standardized anomaly of 500-hPa v wind, hereafter referred to as v500. 300-hPa wind speed. 850-hPa potential temperature ( ) gradient magnitude. 850 600-hPa Eady growth rate. Positive values of 350 250-hPa divergence. Negative values of 850 600-hPa vertical motions ( ). 1000 300-hPa integrated water vapor transport (IVT). 1000 300-hPa integrated moisture flux convergence (IMFC).
Literature review Yamagami and Matsueda (2021) identify forecast busts over the Arctic based on anomaly correlation coefficient and root mean square error (RMSE) of day-6 forecasts of 500-hPa geopotential height over the Arctic for the control runs of five different ensemble prediction systems (EPSs) during 2008 2019. They show that the largest proportion of forecast busts generally occurs during summer, the season during which ACs occur most frequently (e.g., Zhang et al. 2004; Serreze and Barrett 2008). They examine Arctic weather patterns associated with forecast busts during summer at forecast initialization, and find that one of the most frequent patterns is referred to as the Arctic Cyclone pattern
Literature review Composites for Arctic cyclone weather pattern during JJAS 1979 2019. Figure S2 adapted from Yamagami and Matsueda (2021). Yamagami and Matsueda (2021) suggest that forecast busts over the Arctic during summer may be linked to forecast errors in synoptic-scale systems such as ACs. Contours: 500-hPa geopotential height anomalies Contours: SLP anomalies Shading: 850-hPa temperature anomalies Shading: 2-m temperature anomalies
Literature review Forecast errors propagating along upper-tropospheric waveguides (e.g., Langland et al. 2002; Hakim 2005) and forecast errors associated with features embedded within upper-tropospheric waveguides (e.g., troughs and ridges) (e.g., Sanders 1992; Davies and Didione 2013; Berman and Torn 2019) can contribute to forecast errors in the synoptic-scale flow over the middle latitudes. Forecast errors related to baroclinic processes (e.g.,Tribbia and Baumhefner 2004; Davies and Didone 2013) and latent heating (e.g., Rodwell et al. 2013; Mart nez-Alvarado et al. 2016; Grams et al. 2018) can contribute to forecast errors in the synoptic-scale flow over the middle latitudes.
Literature review Figure 1 adapted from Fearon et al. (2021). Panels shown correspond to June August 1998 2017. Fearon et al. (2021) identified moist intrusions based on 1000 300-hPa integrated water vapor transport (IVT). They also identified ACs associated with moist intrusions extending from lower latitudes to poleward across 70 N. (left) Cyclone-center grid cell counts per month for ACs associated with moist intrusions (top values of color bar) (right) Moist intrusion grid cell counts per month (bottom values of color bar)
Literature review Baroclinic processes have been shown to play an important role in the development and intensification of ACs (e.g., Simmonds and Rudeva 2012; Aizawa et al. 2014; Yamazaki et al. 2015; Tao et al. 2017a,b; Yamagami et al. 2017)
Literature review Latent heating associated with the formation of clouds and precipitation has been shown to contribute to the development and intensification of midlatitude cyclones in numerous studies (e.g., Tracton 1973; Kuo and Reed 1988; Reed et al. 1988; Davis et al. 1993; Stoelinga1996; Wernli et al. 2002). There has been a dearth of research that has examined the role of latent heating in the development and intensification of ACs. ACs can be associated with intrusions of warm, moist air into the Arctic (e.g., Binder et al. 2017; Messori et al. 2018; Fearon et al. 2021), which may be related to atmospheric rivers (ARs) and warm conveyor belts (WCBs) of ACs.
Literature review Yamagami et al. (2018a) find that accurate forecasts of AC12 only extend out to 2 3-day lead times relative to the time of peak intensity of AC12. Yamagami et al. (2018b) state that the forecast skill of extraordinary ACs is lower than that of midlatitude cyclones in the Northern Hemisphere. Capute and Torn (2021) show that ACs are less predictable in terms of position, and more predictable in terms of intensity, compared to midlatitude cyclones over the North Atlantic
Literature review Forecast errors propagating along upper-tropospheric waveguides and forecast errors associated with features embedded within upper-tropospheric waveguides shown to contribute to forecast errors in midlatitude cyclones (e.g., Chang et al. 2013; Zheng et al. 2013; Lamberson et al. 2016). The forecast errors related to baroclinic processes (e.g., Sanders 1986; Zhu and Thorpe 2006; Zheng et al. 2013) and latent heating (e.g., Zhang et al. 2003, 2007; Doyle et al. 2014, 2019) have been shown to contribute to forecast errors in midlatitude cyclones.
Literature review The forecast skill of AC12 has been shown to be sensitive to the strength of TPVs (e.g., Tao et al. 2017b; Yamazaki et al. 2015), position of TPVs (e.g., Yamagami et al. 2018a) and to the strength of tropospheric baroclinicity (Tao et al. 2017b). Johnson and Wang (2021) find that track and intensity errors of an AC during July 2018 are sensitive to the position and intensity of TPVs embedded within the Rossby wave, the amount of midtropospheric moisture located within the WCB of the AC, and the structure of the lower-tropospheric thermal field.
Literature review Yamagami et al. (2019) and Capute and Torn (2021), who both show that ACs with lower forecast skill of intensity tend to be stronger. Capute and Torn (2021) find that low-skill ACs are typically embedded in environments characterized by larger lower-to-midtropospheric Eady growth rates compared to high-skill ACs, when considering low-skill ACs and high-skill ACs determined based on forecast skill of intensity. Capute and Torn (2021) find that there is no systematic difference in latent heating between low-skill ACs and high-skill ACs, when considering low-skill ACs and high-skill ACs determined based on forecast skill of intensity.
