Understanding the Economic Impacts of Tourism
Tourism plays a crucial role in stimulating economic growth and development. By generating multiplier effects on the national economy, tourism directly and indirectly increases economic activity, income, employment, and demand for goods and services. Economic impact studies measure the net increase in wealth resulting from tourism, including changes in household income and asset values. Input-output analysis identifies direct, indirect, and induced effects of tourism on production processes, value added, and consumption patterns.
Download Presentation

Please find below an Image/Link to download the presentation.
The content on the website is provided AS IS for your information and personal use only. It may not be sold, licensed, or shared on other websites without obtaining consent from the author. Download presentation by click this link. If you encounter any issues during the download, it is possible that the publisher has removed the file from their server.
E N D
Presentation Transcript
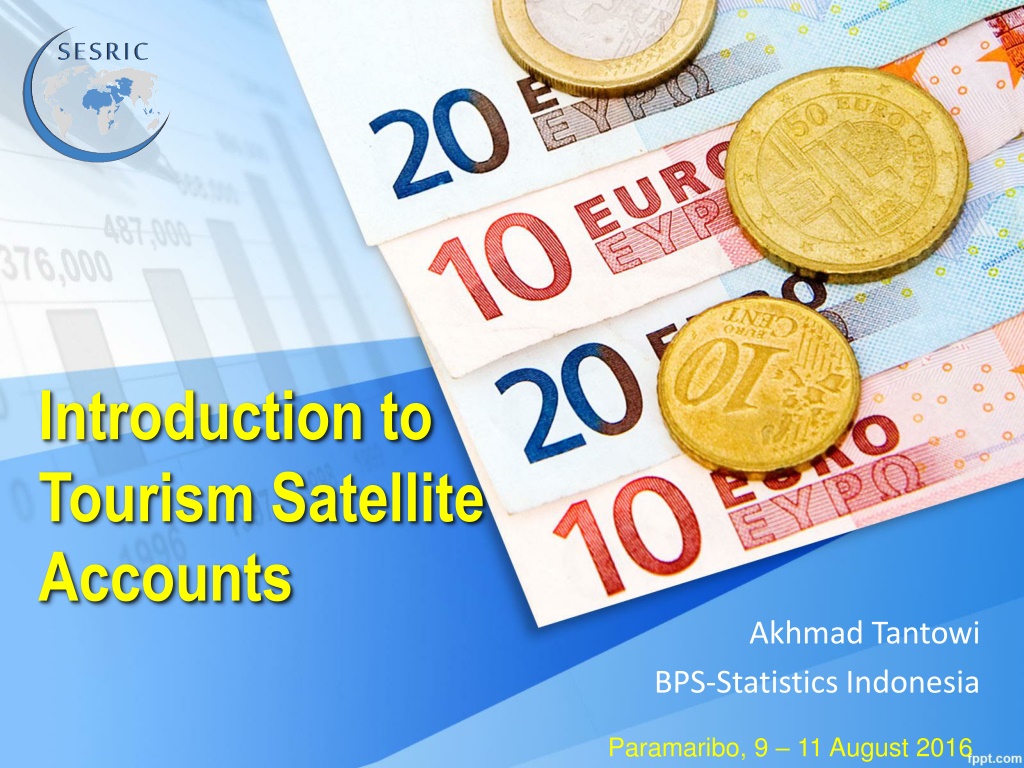
Introduction to Tourism Satellite Accounts Akhmad Tantowi BPS-Statistics Indonesia Paramaribo, 9 11 August 2016
Role of Tourism TOURISM deals with social, culture, politic, environment and economy. THE ECONOMY OF TOURISM is obvious. It has enormous potential of to stimulate growth and development. As identified in the Tourism Satellite Account, tourism and related tourism generates multiplier effects on national economy.
How does Tourism affect Economy and People? Visitors buy goods and services Direct effect Increase income of, government, households, business, etc.. Increase demand for goods and services Indirect effect Increase production of goods and services Increase employment, compensation, profit
International Tourism, 2015 Source: UNWTO Tourism Highlights, 2015 edition
The measurement of the economic impacts of tourism Tourism generates directly and indirectly an increase in economic activity in the places visited, mainly due to demand for goods and services that need to be produced and provided The objective of economic impact studies is to measure economic benefits, that is, the net increase in the wealth of residents resulting from tourism, measured in monetary terms. The change in wealth might occur not only through increased flows of income to households, but also through the change in net worth induced by the change in market value (positiveor negative) of existing assets, both produced and non- produced, as a response to the induced change in demand for such types of assets.
Tourism Effect In terms of input-output analysis, three different types of effects are defined: The direct effects take into account only the immediate effects of the additional demand on production processes and supply of goods and services in terms of additional goods and services, and additional value added and its components. The TSA only makes it possible to measure the direct effects of consumption on output and value added of tourism industries and other industries serving them (TDGVA and TDGDP). The intermediate inputs or capital goods need to be produced or imported, induces a chain of additional demand for different factors of production (that is, inputs, labour, and capital). This chain of effects that enables the activities directly serving visitors is called the indirect effects of visitor demand In addition, the increase of income distributed to the labour force and to the owners of productive capital resulting from incremental visitor demand generates increased demand for goods and services through a rise in household consumption. This additional demand generates a chain of induced effects on a great variety of goods and services.
Methods used to estimate indirect and induced effects of tourism Models based on Input-output analysis By using an input-output table, it is possible to express the technical relationship between output by product or activity (at basic price) and intermediate consumption (at purchasers price) by product or activity. Computable general equilibrium (CGE) models Although based on similar types of data and assumptions, CGE models are designed to relax some of the constraints inherent in input output models, in particular price variation constraints. Multipliers Both procedures are technically complex and have enormous information needs. For this reason, analysts sometimes use exogenous multipliers (estimated from other economies or regions) that convert the value of tourism consumption (total or by product categories) into estimates of the indirect and induced effects.
Historical Background In September 1999, an UNWTO OECD Eurostat intersecretariat working group was created with the object of establishing a common conceptual framework for the development of the methodological design of the TSA The United Nations Statistical Commission endorsed the draft document, as amended, which constitutes the content of the Tourism Satellite Account: Recommended Methodological Framework 2000. The TSA: RMF 2008 is basically an update that takes into account the IRTS 2008, the updates of other macroeconomic-related frameworks, and the experience of member countries in implementing the TSA. The main differences between the TSA: RMF (2000) and the present 2008 update refer basically to the clarification of the concepts of tourism expenditure and tourism consumption, that of the treatment of goods acquired by visitors, and proposals for taking into consideration new forms of vacation home ownership as well as the meetings industry. 8
Overview Tourism as a demand-side phenomenon refers to the activities of visitors and their role in the acquisition of goods and services. It can also be viewed from the supply side, and tourism will then be understood as the set of productive activitiesthat cater mainly to visitors. In order to ensure that the compilation of the integrated tourism statistics is in line with the compilation practices of other economic statistics, it was decided that it shall be further aligned with the updated System of National Accounts 2008 (SNA 2008) 9
Overview (1) The setting up of the TSA consists in analysing in detail all the aspects of demand for goods and services which might be associated with tourism, in establishing the actual interface with the supply of such goods and services within or outside the economy of reference and in describing how this supply interacts with other economic activities, using the supply and use tables as a reference. The Tourism Satellite Account: Recommended Methodological Framework 2008 (TSA: RMF 2008) builds upon this consistency and provides an additional resource to link tourism statistics to the standard tables of the SNA 2008 10
Types of satellite accounts Detailed without expansion of framework 1 Satellite Accounts SNA EX. Tourism, health, education, etc.. Satellite Expansion of SNA framework 2 SNA EX: environment, household, human resources, etc.. Accounts 11
The Complete Tourism Satellite Account Macroeconomic aggregates that describe the size and the direct economic contribution of tourism, such as TDGVA and TDGDP, consistent with similar aggregates for the total economy and for other productive economic activities and functional areas of interest; Detailed data on tourism consumption, a more extended concept associated with the activity of visitors as consumers, and a description of how this demand is met by domestic supply and imports, integrated within tables derived from supply and use tables which can be compiled both at current and constant prices; Detailed production accounts of the tourism industries, including data on employment, linkages with other productive economic activities and gross fixed capital formation; Link between economic data and non-monetary information on tourism, such as number of trips (or visits), duration of stay, purpose of trip, modes of transport, etc., which is required to specify the characteristics of the economic variables. 12
The TSA Analysis The TSA is mainly descriptive in nature and does not include any measurement of the indirect and induced effects of tourist consumption on the economic system as a whole. It means that the impact of tourism on the economy is not fully reflected in the TSA tables and must therefore be measured and analysed using other means. This can be done for instance using input-output or computable general equilibrium models based on the Tourism Satellite Account or other modelling instruments which allow for comprehensive tourism impact analysis 13
TSA Perspectives The TSA: RMF 2008 should be considered from two different perspectives: As a statistical tool that complements those concepts, definitions, aggregates and classifications already presented in the IRTS 2008 and articulates them into analytical tables which provide elements for comparing estimates between regions, countries or groups of countries. These elements are also comparable with other internationally recognized macroeconomic aggregates. As the framework gives guidance for countries in the further development of their system of tourism statistics, the main objective being the completion of the TSA, which could be viewed as a synthesis of such a system. 14
Tourism activities Inbound tourism Demand side Visitors Domestic tourism Outbound tourism Tourism Accommodation F & B services Tourism industries Supply side Travel agent Attraction services etc
No 1. Form of Tourism Tourism Consumption Domestic tourism consumption: the tourism consumption of a resident visitor within the economy of reference Domestic tourism: the activities of a resident visitor within the country of reference either as part of a domestic tourism trip or part of an outbound tourism trip 2. Inbound tourism: the activities of a nonresident visitor within the country of reference on an inbound tourism trips Inbound tourism consumption: the tourism consumption of a non- resident visitor within the economy of reference 3. Outbound tourism: the activities of a resident visitor outside the country of reference, either as part of an outbound tourism trip or as part of a domestic trip. Outbound tourism consumption: the tourism consumption of a resident visitor outside the economy of reference Form of Tourism & Categories of Tourism Consumption 16
No 4. Form of Tourism Tourism Consumption Internal tourism consumption: the tourism consumption of both resident and non-resident visitors within the economy of reference. It is the sum of domestic tourism consumption and inbound tourism consumption National tourism consumption: the tourism consumption of resident visitors, within and outside the economy of reference. It is the sum of domestic tourism consumption and outbound tourism consumption Internal tourism: domestic and inbound tourism, that is, the activities of resident and non-resident visitors within the country of reference as part of domestic or international trips. 5. National tourism: domestic and outbound tourism, that is, the activities of resident visitors, within and outside the country of reference, either as part of domestic or outbound trips Form of Tourism & Categories of Tourism Consumption (cont.) 17
Classification One of the most important issues that can be addressed with tourism statistics is the description and measurement of the role of tourism in the supply of goods and services. The IRTS 2008 presents important new developments concerning the identification of products (tourism characteristic and connected products and other consumption products) and tourism industries using internationally approved classifications of products, CPC Ver. 2) and of productive activities, the ISIC Rev. 4. 18
A. Consumption products: A.1. Tourism characteristic products comprising two subcategories A.1.i. Internationally comparable tourism characteristic products, which represent the core products for international comparison of tourism expenditure A.1.ii. Country-specific tourism characteristic products (to be determined by each country by applying the criteria mentioned in IRTS 2008). A.2. Other consumption products made up of two subcategories, both to be determined by each country and, consequently, country-specific A.2.i. Tourism connected products comprising other products according to their relevance for tourism analysis but that do not satisfy the criteria mentioned in IRTS 2008 A.2.ii. Non-tourism-related consumption products comprising all other consumption goods and services that do not belong to the previous categories Classification of Products for Tourism 19
B. Non-consumption products: This category includes all products that by their nature cannot be consumption goods and services and, therefore, can neither be a part of tourism expenditure, nor a part of tourism consumption, except for valuables that might be acquired by visitors on their trips. Two subcategories are defined B.1. Valuables B.2. Other non-consumption products comprising those products associated with tourism gross fixed capital formation and collective consumption Classification of Products ... (Contd.) 20
Tourism characteristic products are those that satisfy one or both of the following criteria: o Tourism expenditure on the product should represent a significant share of total tourism expenditure (share-of- expenditure/demand condition); o Tourism expenditure on the product should represent a significant share of the supply of the product in the economy (share-of-supply condition). This criterion implies that the supply of a tourism characteristic product would cease to exist in meaningful quantity in the absence of visitors. In the case of tourism connected products, their significance within tourism analysis for the economy of reference is recognized although their link to tourism is limited worldwide. Consequently, lists of such products will be country specific Classification of Products ... (Contd.) 21
Tourism characteristic activities? Tourism characteristic activities are those that typically produce tourism characteristic products. The industries in which the principal activity is tourism characteristic will be called tourism industries 22
Products Activities 1. Accommodation services for visitors 1. Accommodation for visitors 2. Food-and beverage-serving services 2. Food- and beverage-serving activities 3. Railway passenger transport services 3. Railway passenger transport 4. Road passenger transport services 4. Road passenger transport 5. Water passenger transport services 5. Water passenger transport 6. Air passenger transport services 6. Air passenger transport 7. Transport equipment rental services 7. Transport equipment rental Tourism characteristic consumption products/ activities 23
Products Activities 8. Travel agencies and other reservation services 8. Travel agencies and other reservation services activities 9. Cultural services 9. Cultural activities 10. Sports and recreational services 10. Sports and recreational activities 11. Country-specific tourism characteristic goods 11. Retail trade of country-specific tourism characteristic goods 12. Country-specific tourism characteristic services 12. Other country-specific tourism characteristic activities Tourism characteristic consumption products/activities 24
The Tables The 10 tables that make up the TSA are derived from and related to the supply and use tables of the SNA 2008 At a minimum, in order to speak of a satellite account, the TSA must include a detailed presentation of supply and consumption in terms of goods and services acquired by visitors (tables 1-4) and of the industries that produce them (table 5) as well as their components, as this constitutes the core of the TSA system (table 6) The recommended valuation principles are the same as those of the SNA 1993, that is, production should be valued at basic prices and consumption and use at purchasers prices 25
The Tables (Contd.) Tables 1, 2 and 3: Tourism expenditure, according to forms of tourism by products and classes of visitors o Table 1 focuses on inbound tourism o Table 2 on domestic tourism o Table 3 on outbound tourism Table 4 Internal tourism consumption, internal tourism expenditure and other components of tourism consumption, by products Table 5 Production accounts of tourism industries and other industries (at basic prices) Table 6 Domestic supply and internal tourism consumption, by products (at purchasers prices) 26
The Tables (Contd.) Table 7 Employment in the tourism industries Table 8 Tourism gross fixed capital formation of tourism industries and other industries Table 9 Tourism collective consumption, by product and level of government Table 10 Non-monetary indicators 27
Aggregates Main aggregates: Internal tourism expenditure; Internal tourism consumption; Gross value added of tourism industries (GVATI); Tourism direct gross value added (TDGVA); Tourism direct gross domestic product (TDGDP). 28
INTER-INSTITUTIONAL PLATFORM Statistics-Indonesia (BPS) Compiling tourism statistics Compiling I-O table and national/regional accounts Ministry of Tourism (MoT) Organizing the primary data sources Central Bank of Indonesia (BI) Compiling balance of payments 30
DATA SOURCES Administrative Record for Inbound and Outbound Tourist Number of foreign visitors and Indonesian residents going abroad Prepared by Immigration Offices Passenger Exit Survey (PES) Average expenditure and consumption pattern of inbound tourist Conducted by MoT Number of sample around 17,000 respondents 31
DATA SOURCES (Contd.) Domestic Tourist Survey Estimate number of domestic tourist (conducted by BPS every year) Average expenditure and consumption pattern of tourist (conducted jointly by BPS dan MoT every three year) Latest survey was in 2014 Outbound Survey Average expenditure of outbound tourist Conducted by MoT 32
DATA SOURCES (Contd.) Indonesian I-O Table, 2000 (updating) Latest updating one is in 2008 Now BPS is compiling Table I-O 2010 (still in progress) Problems: supply side of tourism sector is not fit with the sectoral I-O table Other sources Secondary data: investment, labor force and tourism promotion 33
INFORMATION ON I-TSA COVER 1) Economic profile of tourism sector 2) Tourist expenditure structure and its magnitude 3) Structure of tourism related sector 4) Structure of employment and its share on national labor force 5) Contribution of tourism sector on national economy 34
ECONOMIC IMPACT OF TOURISM Use I-O model to measure economic impact of tourism Expenditures (tourists, capital formation and tourism development made by government and private) treated as final demand in I-O framework Each expenditure is reclassified following sectoral I-O classification Economic impact: Impact of tourism in generating sectoral value of production, GDP, wages & salaries, indirect taxes and sectoral employment 35
Table 1. The economic impact of tourism sector, 2013 (trillion Rp) Output Total GVA/GNP Total Labor force Total SECTORS NO. % % % Tourism (4) 2.95 1.78 4.10 3.02 4.08 2.06 12.62 93.91 47.50 13.10 6.25 22.14 14.91 2.65 1.91 4.32 Tourism (6) 2.78 1.79 4.37 3.02 4.08 2.06 12.62 93.91 47.50 13.10 6.25 22.14 14.91 2.65 1.93 4.02 Tourism (8) 6.32 8.26 13.14 7.42 11.93 5.88 33.01 90.81 66.87 20.93 13.86 74.85 38.26 8.39 3.19 8.52 (Billion Rp) (3) 55,621.9 22,653.5 237,866.1 5,731.3 101,967.7 40,582.9 61,008.0 62,088.3 4,248.5 58,046.4 6,412.3 57,306.1 12,091.5 9,918.0 54,463.9 790,006.3 (Billion Rp) (5) 36,391.1 18,304.8 94,091.1 2,119.3 37,020.7 21,671.8 26,375.7 36,894.3 1,276.4 24,141.0 2,021.5 17,502.6 6,891.5 7,743.3 32,579.8 365,025.0 (000) (7) 2,479.6 117.8 1,966.4 18.7 757.4 1,265.6 710.0 396.9 73.9 645.3 70.1 216.0 151.5 59.9 680.8 9,609.8 (1) 1 2 3 4 5 6 7 8 9 10 Land transport 11 Water transport 12 Air transport 13 Auxiliary transport 14 Communication 15 Other service (2) Agriculture Mining & Quarying Manufacturing Elect., gas, water supply Construction Trade Restaurant Hotel Railway transport Jumlah 36
ECONOMIC IMPACT OF TOURISM, 2013 Wages/ Salaries Indirect Taxes Employ- ment Output GDP/GVA Description (billion Rp) 18,280.7 (billion Rp) 9,084.0 (billion Rp) 2,850.4 (billion Rp) (000) Total Economy 337.6 112.8 Total of Tourism Impact 1. Inbound Tourist 2. Domestic Tourist 3. Outbound Tourist (pre+post) 4. Investment 7. Promotion 790.0 229.4 317.9 10.7 365.0 109.4 150.1 4.9 118.3 36.1 48.1 1.6 13.3 4.1 5.4 0.2 9.6 3.0 4.3 0.1 219.9 12.2 94.5 6.1 30.5 2.1 3.4 0.2 2.0 0.2 Share of Tourism (%) 1. Inbound Tourist 2. Domestic Tourist 3. Outbound Tourist (pre+post) 4. Investment 7. Promotion 4.32 1.25 1.74 0.06 4.02 1.20 1.65 0.05 4.15 1.27 1.69 0.06 3.93 1.22 1.60 0.05 8.52 2.64 3.83 0.12 1.20 0.07 1.04 0.07 1.07 0.07 1.00 0.06 1.79 0.14 37
Indonesia Tourism Economic Impact, 2013 Economi Impact I-O Multiplier Matrix Inbound tourism consumption (129,75) TABLE I-O 2008 UPDATING Impact on goods and services prod (790,01) 4,32 % Total National Product (18.280,75) Domestic tourism consumption (177,84) Impact on GDP (365,02) 4,02 % Outbound tourism consumption (pre+post) (5,88) GDP (9.083,97) 8,52 % Impact on workers (9,61) Total workers (112,76) Tourism investment (121,30) 4,15 % Total worker conpent (2.850,39) Impact on wage/salary (118,34) Gov exp on tourism sector (7,12) Impact on indirect tax (13,26) 3,93 % Total Tax (337,63) in trillion rupiahs, except worker in million persons 38
