Understanding Hazard Curves in Dam Safety Risk Assessments
This content focuses on the role of hazard curves in dam safety risk assessments, emphasizing the level of effort required for their development and the use of HEC software. It highlights the three components of risk (hazard, performance, consequence), discusses hazardous loads and potential consequences, and delves into risk calculation formulas. The importance of senior guidance for higher-level studies is also emphasized throughout.
Download Presentation

Please find below an Image/Link to download the presentation.
The content on the website is provided AS IS for your information and personal use only. It may not be sold, licensed, or shared on other websites without obtaining consent from the author. Download presentation by click this link. If you encounter any issues during the download, it is possible that the publisher has removed the file from their server.
E N D
Presentation Transcript
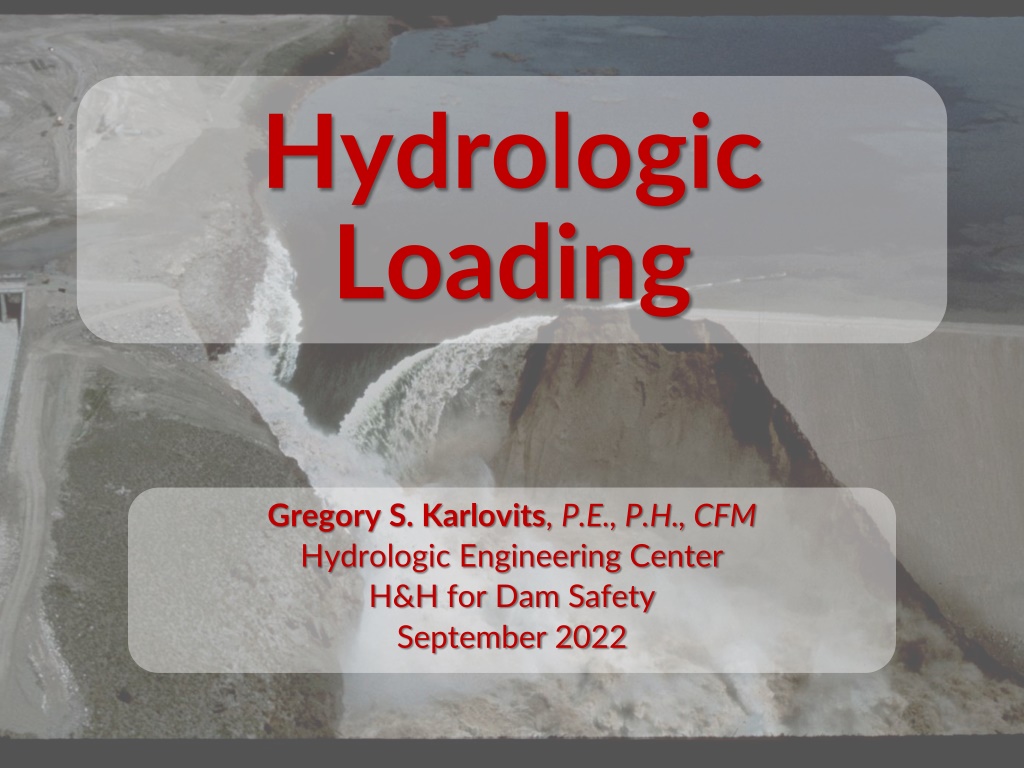
Hydrologic Loading Gregory S. Karlovits, P.E., P.H., CFM Hydrologic Engineering Center H&H for Dam Safety September 2022
Student Goals Understand the role of hazard curves in risk assessments Identify level of effort required for hazard curve development Become familiar with HEC software used to develop hazard curves Overall: Tie together the dam safety risk assessment process and the H&H software needed to succeed!
What Were Not Doing Disclaimer! Not a recipe for doing hydrologic loading on your own See Risk Management Center (RMC) SQRA workshops Higher-level studies usually need guidance from senior H&H cadre members
Risk Three components: 1. Hazard 2. Performance 3. Consequence Hydrologic loading is concerned with the hazard
Hazard Hazards have a chance to cause harm. Some loads can be hazardous. Potentially hazardous load examples: A reservoir fills to the crest. Spillway flow begins. High winds cause waves running up the side of the dam.
Performance Hazards do not cause harm if the structure performs. If the structure fails, consequences can occur. Failure is not always certain for a load.
Performance Example Levee Fragility National Research Council. 2013. Levees and the National Flood Insurance Program: Improving Policies and Practices.
Consequences Dam failure consequences usually entail: Economic damage Loss of life A range of consequences are possible depending on the failure H&H input to consequence modeling is usually inundation mapping Covered later this week!
Risk risk = load * performance | load * consequence | performance given given
Overtopping Example Load Stage dam crest elevation Performance What is the probability the dam fails if it is overtopped? Consequence What is the life loss/economic damage if the dam fails due to overtopping?
Loading Probability Missing piece: What is the probability of the load? We can imagine bigger and bigger loads, but how likely are they? For hydrologic failure modes, stage is the most important load Reservoir stage-frequency curves establish loading probability
Stage-Frequency Curve Reservoir Stage Reservoir Stage Annual Chance of Exceeding Stage Annual Chance of Exceeding Stage
Stage-Frequency Curves Drawn like flow-frequency curves Extends wellpast observed data Shows annual exceedance probability (AEP) for critical stages Spillway activation Top of dam Inflow design flood (IDF)
Stage-Frequency Curve Top of Dam Top of Dam Reservoir Stage Reservoir Stage AEP AEP OT OT Annual Chance of Exceeding Stage Annual Chance of Exceeding Stage
Risk Assessment Recap Estimating dam risk requires understanding the probability of hazardous loads Hydrologic loading/hazard curves show the AEP of a range of reservoir stages Stage-frequency curve
The Challenges No Observations No Observations in Hazard Range in Hazard Range Reservoir Stage Reservoir Stage Limited Record of Limited Record of Observed Stages Observed Stages Annual Chance of Exceeding Stage Annual Chance of Exceeding Stage
Extrapolation Can t we just draw a line?
Extrapolation Account for Anticipated Account for Anticipated Behavior Here Behavior Here Reservoir Stage Reservoir Stage Annual Chance of Exceeding Stage Annual Chance of Exceeding Stage
Flood Stages How high does the pool get during a flood? Depends on: How high the pool was before the flood How big the flood is Total inflow volume Peak inflow How the dam is operated Gate operations Downstream controls
Reservoir Peak Stage Starting Stage Peak Stage Operations Flood Hydrograph
Extrapolation What can we extrapolate better than stages? Flow-frequency curves Easier to develop Harder to create big sample sizes Harder to model multiple dams Precipitation-frequency curves Harder to develop Easier to create big sample sizes Requires hydrologic modeling to get runoff Possibly easier to model multiple dams
Streamflow-Frequency Method Assume peak stage primarily driven by magnitude of flood Starting stage causes far less variability Flood magnitude varies due to natural variability Use Monte Carlo simulation
Monte Carlo Simulation f(x) f(x) Replace a probability distribution with a large sample that follows that distribution
Streamflow-Frequency Method 1-day 3-day 7-day 15-day Daily Average Flow Daily Average Flow Observed Inflows Observed Inflows 30-day Model Model Extrapolation Extrapolation Annual Chance of Exceeding Flow Annual Chance of Exceeding Flow
Large Streamflow Sample Generation Template Hydrograph Shapes Inflow Frequency Curve Scaling Scaling Q Flood Hydrograph To Route Repeat (a lot) Repeat (a lot) p
Starting Stage Starting stage may be affected by season of event Seasonal operations
Starting Stage Modeled by one or more seasonal stage- duration curves Sample Each Sample Each Flood Event Flood Event
Operations Generally treated deterministically If gate failures are being considered, those may be modeled randomly Generally not at PA/SQRA level
Reservoir Peak Stage Starting Stage SAMPLED SAMPLED Peak Stage Operations ROUTED ROUTED RESULT RESULT SAMPLED SAMPLED Flood Hydrograph
Results Maximum Reservoir Stage Each pt is a routed event Simulation count controls frequency limits Average return interval (years)
Uncertainty Run the simulation, varying the flow frequency parameters Each line is a realization Uncertainty for rare events substantial
Including More Information
Level of Effort Streamflow Frequency (Periodic Assessment) (Semi-Quantitative Risk Assessment) PA/SQRA At-site volume-frequency Regional skew information if available Historical information if available (Issue Evaluation Study) (Dam Safety Modification Study) IES/DSMS At-site volume-frequency Historical information Regional skew highly recommended Paleoflood analysis if possible Precipitation-based methods may be preferable
Precipitation-Frequency Method Instead of sampling inflows, sample precipitation Compute runoff with a hydrologic model Route inflow hydrographs
Precipitation-Frequency Analyze annual maximum precipitation Regionalize the estimates Space-for-time substitution Handle the tradeoff: More storms of the same kind, but Multiple stations can be dominated by the exact same events
Space for Time Substitution Gather up weather stations with similar climatology to the area of interest 295 final sites for 295 final sites for the Willamette Basin the Willamette Basin
Space for Time Substitution Partition stations into meteorologically homogeneous regions 10 final regions for 10 final regions for the Willamette Basin the Willamette Basin
Space for Time Substitution Analyze regional trends in rainfall statistics Predict rainfall statistics using physical characteristics
Space for Time Substitution Fit a probability distribution using the mapped statistics
Spatial Average + Point-to-Area Reduction Choose Frequency Compute Everywhere Take Basin Average Apply ARF Basin-Average Precipitation (in)
Q p Temporal Pattern Precip Frequency Spatial Pattern Pattern Scaling Scaling Scaled Spatial Pattern Scaled Temporal Pattern
Scaled Spatial Pattern Hydrologic Model Flood Hydrograph Scaled Temporal Pattern
Reservoir Peak Stage Starting Stage Peak Stage Operations Flood Hydrograph
Why Bother? Larger sample sizes Regionalization Homogeneous samples Storm typing Complex hydrology Continuous meteorology Multiple events per year Multiple reservoirs
Level of Effort Precipitation- Based IES/DSMS Develop regional precipitation-frequency Calibrate hydrologic model(s) Generate plausible hydrometeorology Simulate synthetic events and route to reservoirs Significantly more work than streamflow-based.
Level of Effort Recap Screening/limited studies: Streamflow Hydrologic failures not driving: Streamflow Single dam/simple ops/simple hydrology, IES/DSMS: Event precipitation, maybe streamflow Multiple dams/complex ops/complex hydrology: Continuous precipitation
HEC-SSP Statistical analysis software Flow frequency analysis with EMA Bulletin 17 Analysis Duration analyses E.g. reservoir stage, flow Seasonality analysis Within Distribution Fitting Analysis
HEC-HMS Hydrologic modeling software Capable of simulating parameter uncertainty Optimization tools for calibration Very simple reservoir operations Needed for precipitation-based methods Hypothetical storm modeling tools
HEC-RAS 1D/2D hydraulic modeling software May be necessary for routing floods through very tricky areas Not a usual part of the sequence
HEC-ResSim Reservoir operations simulation software Model operations from very simple to extremely complex Model one or more reservoirs Random samples of states Starting elevation/storage, etc.
