Understanding Abundance Estimates in Fisheries Management
Explore the concept of abundance estimates in fisheries management, including natural mortality, recruitment, population numbers, fishing mortality, immigration, and emigration. Learn about common abundance estimation methods like CPE/CPUE, depletion/removal estimates, and mark-recapture techniques. Understand how density of fish is determined in lakes and streams, investigate catch-per-unit-effort calculations, and grasp the significance of CPE in measuring relative abundance. Get insights into how fishing effort and catchability coefficients influence abundance estimates. Discover the impact of non-constant q values on abundance overestimation.
Uploaded on Sep 19, 2024 | 0 Views
Download Presentation

Please find below an Image/Link to download the presentation.
The content on the website is provided AS IS for your information and personal use only. It may not be sold, licensed, or shared on other websites without obtaining consent from the author. Download presentation by click this link. If you encounter any issues during the download, it is possible that the publisher has removed the file from their server.
E N D
Presentation Transcript
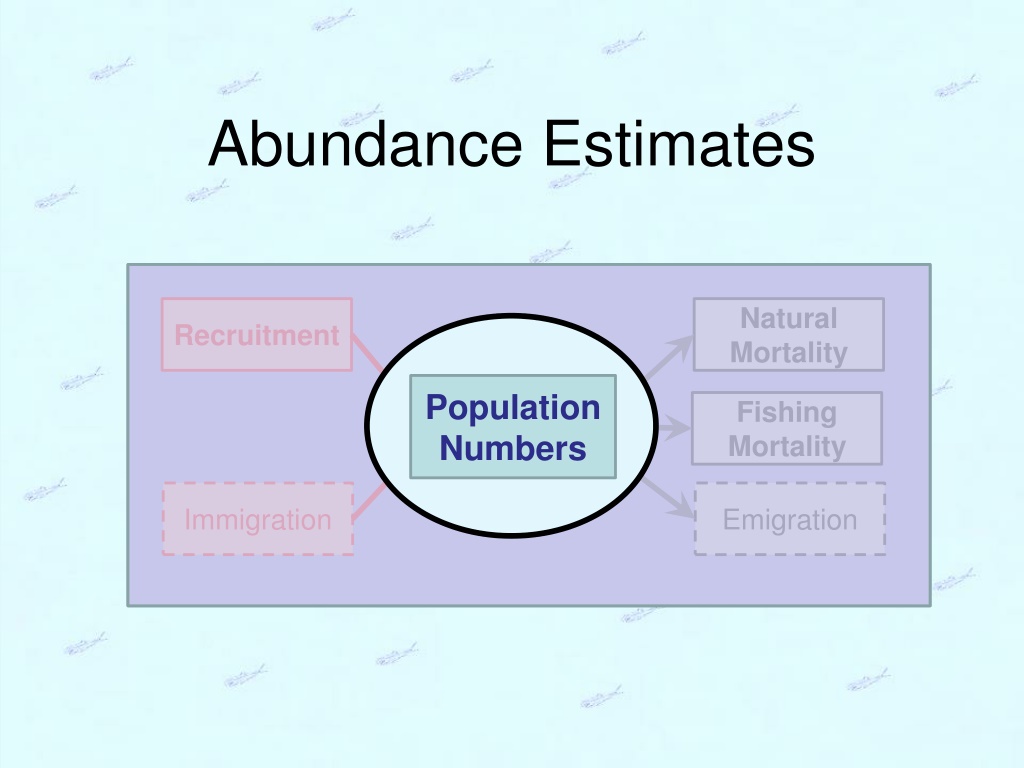
Abundance Estimates Natural Mortality Recruitment Population Numbers Fishing Mortality Immigration Emigration
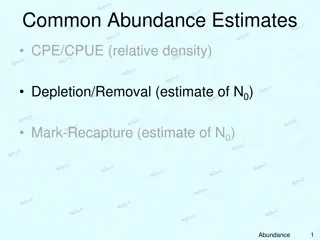
Common Abundance Estimates CPE/CPUE (relative density) Depletion/Removal (estimate of N0) Mark-Recapture (estimate of N0) 2 Abundance -- CPE
Catch-Per-Unit-Effort Consider Lake A 4 nets, 40 total fish Lake B 2 nets, 30 total fish Which lake has a higher density of fish? Consider Stream A 50 fish in 25 minutes of shocking Stream B 60 fish in 35 minutes of shocking Which stream has a higher density of fish? 3 Abundance -- CPE
Catch-Per-Unit-Effort CPUE or CPE Calculated as (Catch / Effort)*scaling factor Examples 50 Lake Trout in 1600 m of gillnet set for 2 nights 50 Brook Trout in 1600 s of electrofishing 4 Abundance -- CPE
Catch-Per-Unit-Effort GillnetLonglines Electrofishing Trawling 5 Abundance -- CPE
Catch-Per-Unit-Effort Define Ct = catch at time t ft = fishing effort at time t q = catchability coefficient proportion of population captured w/ one unit of effort As long as one unit of effort is small (discuss more later) What is q*ft q*ft*Nt q*Nt Thus, CPE measures relative abundance 6 Abundance -- CPE
CPE Measures Relative Abundance Ct/ft = q*Nt CPE directly estimates abundance Things seem as they really are i.e., if CPE de/increases then abundance de/increases proportionately CPEt Abundance (Nt) 7 Abundance -- CPE
CPE Measures Relative Abundance ONLY of portion of stock vulnerable to the gear if q is constant (see readings) 8 Abundance -- CPE
Non-Constant q (Hyperstability) CPE overestimates abundance Things seem better than they really are Common when fisheries are good at searching and finding fish CPEt Abundance (Nt) 9 Abundance -- CPE
Non-Constant q (Hyperdepletion) CPE underestimates abundance Things seem worse than they really are Common when fish get sequentially harder to catch (e.g., spook ) CPEt Abundance (Nt) 10 Abundance -- CPE
