Fisheries Abundance Estimates and Depletion Methods
Explore common abundance estimation techniques like CPUE, mark-recapture, and depletion methods. Understand how to calculate relative density, depletion estimates, and cumulative catch. Discover the concepts of N0, Nt, Ct, and q in depletion estimates using regression models. Learn about the assumptions of the Leslie Model and the complexity of K-pass Removal methods in fish population assessment.

Download Presentation

Please find below an Image/Link to download the presentation.
The content on the website is provided AS IS for your information and personal use only. It may not be sold, licensed, or shared on other websites without obtaining consent from the author.If you encounter any issues during the download, it is possible that the publisher has removed the file from their server.
You are allowed to download the files provided on this website for personal or commercial use, subject to the condition that they are used lawfully. All files are the property of their respective owners.
The content on the website is provided AS IS for your information and personal use only. It may not be sold, licensed, or shared on other websites without obtaining consent from the author.
E N D
Presentation Transcript
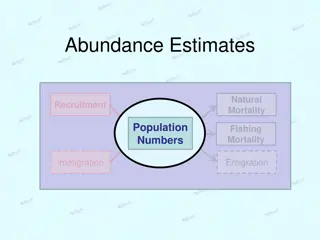
Common Abundance Estimates CPE/CPUE (relative density) Depletion/Removal (estimate of N0) Mark-Recapture (estimate of N0) 1 Abundance
Concept Depletion Estimate Consider this situation Sampling a pond with three fyke nets No limit on number of sampling events (days) Fish are removed from pond when captured Compute CPE as total fish/day Compute cumulative catch prior to each day What would the following graph look like? 2 Abundance
Concept Depletion Estimate CPE Cumulative Catch 3 Abundance
Development Depletion Estimate Define (along with N0, Nt, Ct, and q) Kt-1 = cumulative catch prior to time t i.e., Key relationship Substitute CPE equation for Nt and simplify What type of function is this? 4 Abundance
Development Depletion Estimate Use regression to fit linear model q = -slope N0 = intercept/q 5 Abundance
Proportion Caught As noted in CPUE module, q is proportion of population caught with one unit of effort but only if effort is small (and then it is only an approximation). q is an instantaneous rate that must be converted to an actual rate with 1-e-q If q=0.02 then 1-e-0.02 = 0.0198 If q=1.00 then 1-e-1.00 = 0.0632 6 Abundance
Class Exercise Do First Question 7 Abundance
Leslie Model Assumptions The population is closed. Catchability (q) is constant. All fish are equally vulnerable to capture method. CPE is substantially reduced by fish removal. Catches remove more than 2% of population. Units of effort are independent - i.e., the individual units of capture method do not compete with each other. 8 Abundance
K-pass Removal Common in stream work Several passes through an area are made Number of fish captured are counted Captured fish are physically removed Derivation of estimates is complex. Zippin and Carle-Strub methods are common Carle-Strub somewhat more general 9 Abundance
Class Exercise Do Second Question 10 Abundance