Table of Contents
Table of Contents
1
Project Jaguar
Goldman Stanley
Section 1
Market Update and Summary
3
Section 2
Review of Jaguar Management Forecasts
7
Section 3
Jaguar Valuation
15
Section 4
Potential Strategic Alternatives
28
Section 5
Process Recommendations
39
Appendix A
Financial Projection Assumptions
44
Appendix B
Valuation Data
48
Executive Summary
2
Jaguar Could Achieve a Positive Outcome for Shareholders with the Right Process
MARKET UPDATE AND SUMMARY
Over the past year, Jaguar’s share price has ranged between $131.51 and $186.42, recently falling by
25% after its Q2 earnings announcement
The Comparable Public Companies, Precedent Transactions, and a Discounted Cash Flow (DCF)
analysis based on management numbers point to a company undervalued by at least 30%
Jaguar’s Debt / Total Capital is nearly 50% following the GW Pharma acquisition, and issuing Equity
near the 52-week-low share price would create significant dilution
Given Jaguar’s Cash balance and the constraints above, smaller deals may be viable, but nothing that
would substantially change the company’s short-term valuation
Jaguar’s promising portfolio and market position could allow it to achieve a significantly higher
valuation in an acquisition and acquire more resources for R&D and distribution
We recommend a highly targeted process focused on the most likely (“Tier 1”) potential partners,
along with an outreach to Tier 2 potential partners
Current Valuation
Jaguar is Significantly Undervalued at Its Current Share Price
Strategic Alternatives
Proposed Process
Equity / Debt Issuances and Add-On Acquisitions Are Not Ideal
A 30 – 50% Premium ($170 – $200) is Possible with the Right Process
Project Jaguar
Goldman Stanley
Summary of Operational Forecasts
3
Per Jaguar Management; See Appendix A for Additional Details
MARKET UPDATE AND SUMMARY
P
r
o
j
e
c
t
J
a
g
u
a
r
Goldman Stanley
Comparison of Product Peak Sales and Operational KPIs
Epidiolex Peak Sales
Zepzelca Peak Sales
Risk-Adjusted
Pipeline Peak Sales
EBITDA Margins
Management Forecast
(1)
Consensus Forecast
(2)
Downside Case
(3)
Xywav Peak Sales
FY 30 Revenue
(CAGR)
$1.0 billion in FY 25
$1.8 billion in FY 27
$
0.5 billion in FY 25
$0.3 billion in FY 30
$1.3 billion in FY 25
44% falling to 39%
$2.5 billion in FY 27
$0.7 billion in FY 25
$0.5 billion in FY 30
44% falling to 39%
$4.6 billion (7%)
$3.8 billion (5%)
$0.7 billion in FY 25
$1.3 billion in FY 27
$
0.3 billion in FY 25
$0.2 billion in FY 30
44% falling to 39%
$3.1 billion (3%)
(1) Per management estimates from 8/3 meeting.
(2) Based on Capital IQ median forecasts as of 8/31/2022.
(3) Based on low end of market size and share estimates from press releases.
Company Profile: Amgen
4
($ USD in Billions)
POTENTIAL STRATEGIC ALTERNATIVES
Project Jaguar
Goldman Stanley
Amgen
Business Description
Management Team
Business Segments and Product Lines
Notable Acquisitions
Financial Information
(1)
One-Year Price History
(1)
Headquarters:
California
Employees:
24,200
Founded:
1980
Market Cap:
$128.1
Enterprise Value:
$152.8
LTM Revenue:
$25.5
LTM EBITDA:
$12.6
TEV / Revenue:
6.0x
TEV / EBITDA:
12.2x
Amgen Inc. discovers, develops, manufactures, and delivers human
therapeutics worldwide. It focuses on inflammation, oncology/hematology,
bone health, cardiovascular disease, nephrology, and neuroscience areas.
Amgen Inc. serves healthcare providers, including physicians or their clinics,
dialysis centers, hospitals, and pharmacies. It distributes its products through
pharmaceutical wholesale distributors, as well as direct-to-consumer channels.
Robert Bradway
Chairmen & CEO
Peter Griffith
EVP & CFO
Esteban Santos
EVP, Operations
Linda Louie
VP, Finance & CAO
Mike Zahigian
SVP & CIO
Jonathan Graham
EVP & GC
Nancy Grygiel
SVP & CCO
Enbrel
– To treat plaque psoriasis, rheumatoid arthritis, and psoriatic
arthritis.
Neulasta
– Reduces the chance of infection due a low white blood cell count
in patients with cancer.
Prolia
– To treat postmenopausal women with osteoporosis.
Xgeva
– To prevent skeletal-related events.
Otezla
– To treat adult patients with plaque psoriasis, psoriatic arthritis, and
oral ulcers associated with Behçet’s disease.
Aranesp
– To treat a lower-than-normal number of red blood cells and
anemia.
KYPROLIS
– To treat patients with relapsed or refractory multiple myeloma.
Repatha
– To reduce the risks of myocardial infarction, stroke, and coronary
revascularization.
Other Products
– Nplate, Vectibix, MVASI, Parsabiv, EPOGEN, KANJINTI,
BLINCYTO, Aimovig, EVENITY, AMGEVITATM, Sensipar/Mimpara,
NEUPOGEN, IMLYGIC, Corlanor, and AVSOLA.
(1) Financial data as of August 31, 2021.
Otezla Worldwide
Rights
$13.4 billion
Aug 2019
Onyx
Pharmaceuticals
$10.0 billion
Aug 2013
Overview of Jaguar’s Product Pipeline
5
Approval Statuses Based on Latest Investor Presentation
(1)
REVIEW OF JAGUAR MANAGEMENT FORECASTS
Project Jaguar
Goldman Stanley
1) Source: Management.
Phase 3 Trial Planned
Oncology
Cannabinoids
Neuroscience
Preliminary Management Assumptions
6
Summary of Key Product Assumptions in Management Case
(1)
REVIEW OF JAGUAR MANAGEMENT FORECASTS
Project Jaguar
Goldman Stanley
(1) Per management estimates from 8/3 meeting.
($ as Stated Except Peak Sales Estimates in $ Billions or $ Millions)
Criteria for Potential Strategic Partners
7
Goldman Stanley Considered a Broad Range of Potential Biopharma Partners
POTENTIAL STRATEGIC ALTERNATIVES
Project Jaguar
Goldman Stanley
At $200 / share, Jaguar would be worth an Enterprise Value of over $18 billion; potential partners
should be able to use $18 billion in combined Cash and Debt to fund a potential deal
Both branded and generics companies should be considered, given recent M&A activity
Size, Ability to Pay, Product Pipeline, and Strategic Fit Should All Be Considered
Significantly larger than Jaguar
Tier 1 Potential Partners
Closer to Jaguar’s size
Capable of paying at least $18-
20 billion in Cash and Debt
May have to issue Stock to
fund the full purchase price
Solid product and pipeline fit
Solid product and pipeline fit
Tier 2 Potential Partners
Jaguar – WACC Analysis
8
Based on Jaguar’s Historical Beta and Capital Structure and Comparable Companies
(1)
JAGUAR VALUATION
Project Jaguar
Goldman Stanley
(1) Market data based on closing prices as of 8/31/2021.
($ USD in Billions)
Goldman Stanley
reviewed Jaguar’s
historical data and
information from the
comparable companies:
Given the wide
differences in capital
structures, it is crucial
to calculate WACC via
multiple methods
The DCF assumes an
initial WACC of 7.0%
declining to 5.4% by
Year 10, based on
WACC figures in the
6.5% – 8.5% range for
Jaguar’s higher-growth
peers
The final 5.4% rate in
the Terminal Period is
close to the average
WACC produced by the
three methods
described here
Calibri Slide
Title – 24
Content
/Section Title
Text – 14
Bullet
, Subtitle, and Main Paragraph Text
– 12
Table, Chart
,
Profile,
and Currency
Text – 10
Full Dates on Charts – 9
Footnotes – 8
Outline: black, ½ pt.
204
– 209 – 215
72 – 80 – 89
94 – 124
– 158
17 – 61 – 99
Normal shapes w/ text
9
Comprehensive analysis of Jaguar's market position, management forecasts, valuation, potential strategic alternatives, and process recommendations. Highlights Jaguar's undervaluation and proposes a targeted process to enhance shareholder value. Includes comparisons of operational forecasts and explores potential partnerships.

Download Presentation

Please find below an Image/Link to download the presentation.
The content on the website is provided AS IS for your information and personal use only. It may not be sold, licensed, or shared on other websites without obtaining consent from the author.If you encounter any issues during the download, it is possible that the publisher has removed the file from their server.
You are allowed to download the files provided on this website for personal or commercial use, subject to the condition that they are used lawfully. All files are the property of their respective owners.
The content on the website is provided AS IS for your information and personal use only. It may not be sold, licensed, or shared on other websites without obtaining consent from the author.
E N D
Presentation Transcript
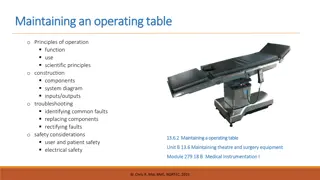
Project Jaguar Table of Contents Section 1 Market Update and Summary 3 Section 2 Review of Jaguar Management Forecasts 7 Section 3 Jaguar Valuation 15 Section 4 Potential Strategic Alternatives 28 Section 5 Process Recommendations 39 Appendix A Financial Projection Assumptions 44 Appendix B Valuation Data 48 Goldman Stanley 1
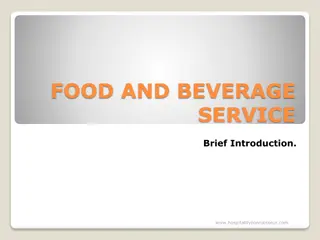
Project Jaguar MARKET UPDATE AND SUMMARY Executive Summary Jaguar Could Achieve a Positive Outcome for Shareholders with the Right Process Current Valuation Jaguar is Significantly Undervalued at Its Current Share Price Over the past year, Jaguar s share price has ranged between $131.51 and $186.42, recently falling by 25% after its Q2 earnings announcement The Comparable Public Companies, Precedent Transactions, and a Discounted Cash Flow (DCF) analysis based on management numbers point to a company undervalued by at least 30% Strategic Alternatives Equity / Debt Issuances and Add-On Acquisitions Are Not Ideal Jaguar s Debt / Total Capital is nearly 50% following the GW Pharma acquisition, and issuing Equity near the 52-week-low share price would create significant dilution Given Jaguar s Cash balance and the constraints above, smaller deals may be viable, but nothing that would substantially change the company s short-term valuation Proposed Process A 30 50% Premium ($170 $200) is Possible with the Right Process Jaguar s promising portfolio and market position could allow it to achieve a significantly higher valuation in an acquisition and acquire more resources for R&D and distribution We recommend a highly targeted process focused on the most likely ( Tier 1 ) potential partners, along with an outreach to Tier 2 potential partners Goldman Stanley 2
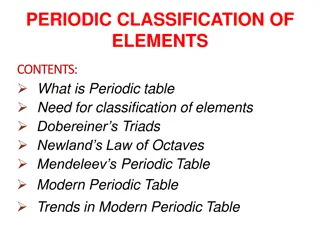
Project Jaguar Project Jaguar MARKET UPDATE AND SUMMARY Summary of Operational Forecasts Per Jaguar Management; See Appendix A for Additional Details Comparison of Product Peak Sales and Operational KPIs Management Forecast(1) Consensus Forecast(2) Downside Case(3) $1.3 billion in FY 25 $1.0 billion in FY 25 $0.7 billion in FY 25 Xywav Peak Sales $2.5 billion in FY 27 $1.8 billion in FY 27 $1.3 billion in FY 27 Epidiolex Peak Sales $0.7 billion in FY 25 $0.5 billion in FY 25 $0.3 billion in FY 25 Zepzelca Peak Sales Risk-Adjusted Pipeline Peak Sales $0.5 billion in FY 30 $0.3 billion in FY 30 $0.2 billion in FY 30 FY 30 Revenue (CAGR) $4.6 billion (7%) $3.8 billion (5%) $3.1 billion (3%) 44% falling to 39% 44% falling to 39% 44% falling to 39% EBITDA Margins (1) Per management estimates from 8/3 meeting. (2) Based on Capital IQ median forecasts as of 8/31/2022. (3) Based on low end of market size and share estimates from press releases. Goldman Stanley 3
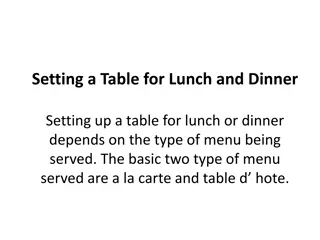
Project Jaguar POTENTIAL STRATEGIC ALTERNATIVES Company Profile: Amgen ($ USD in Billions) Business Description Management Team Amgen Inc. discovers, develops, manufactures, and delivers human therapeutics worldwide. It focuses on inflammation, oncology/hematology, bone health, cardiovascular disease, nephrology, and neuroscience areas. Robert Bradway Peter Griffith Esteban Santos Linda Louie Mike Zahigian Jonathan Graham Nancy Grygiel Chairmen & CEO EVP & CFO EVP, Operations VP, Finance & CAO SVP & CIO EVP & GC SVP & CCO Amgen Inc. serves healthcare providers, including physicians or their clinics, dialysis centers, hospitals, and pharmacies. It distributes its products through pharmaceutical wholesale distributors, as well as direct-to-consumer channels. Amgen Headquarters: Employees: Founded: California 24,200 1980 Financial Information(1) Business Segments and Product Lines Notable Acquisitions Market Cap: Enterprise Value: LTM Revenue: LTM EBITDA: TEV / Revenue: TEV / EBITDA: $128.1 $152.8 $25.5 $12.6 6.0x 12.2x Enbrel To treat plaque psoriasis, rheumatoid arthritis, and psoriatic arthritis. Neulasta Reduces the chance of infection due a low white blood cell count in patients with cancer. Prolia To treat postmenopausal women with osteoporosis. Xgeva To prevent skeletal-related events. Otezla To treat adult patients with plaque psoriasis, psoriatic arthritis, and oral ulcers associated with Beh et s disease. Aranesp To treat a lower-than-normal number of red blood cells and anemia. KYPROLIS To treat patients with relapsed or refractory multiple myeloma. Repatha To reduce the risks of myocardial infarction, stroke, and coronary revascularization. Other Products Nplate, Vectibix, MVASI, Parsabiv, EPOGEN, KANJINTI, BLINCYTO, Aimovig, EVENITY, AMGEVITATM, Sensipar/Mimpara, NEUPOGEN, IMLYGIC, Corlanor, and AVSOLA. Otezla Worldwide Rights $13.4 billion Aug 2019 One-Year Price History(1) Onyx Pharmaceuticals $10.0 billion Aug 2013 Goldman Stanley 4 (1) Financial data as of August 31, 2021.
Project Jaguar REVIEW OF JAGUAR MANAGEMENT FORECASTS Overview of Jaguar s Product Pipeline Approval Statuses Based on Latest Investor Presentation(1) Included in Valuation Product Pre-Clinical Phase 1 Phase 2 Phase 3 Approved JZP-458 (Rylaze) FDA Approval on June 30, 2021 Zepzelca (1L SCLC) Phase 3 Trial Planned Vyxeos (AML or HR-MDS) Cooperative Group Study Planned Epidiolex (EMAS) Phase 3 Trial Planned JZP-385 (Tremor) Phase 3 Trial Planned JZP-150 (PTSD) Phase 3 Trial Planned JZP-324 (Oxybate) JZP-341 (Hematological) Oncology Cannabinoids Neuroscience Goldman Stanley 5 1) Source: Management.
Project Jaguar REVIEW OF JAGUAR MANAGEMENT FORECASTS Preliminary Management Assumptions Summary of Key Product Assumptions in Management Case(1) ($ as Stated Except Peak Sales Estimates in $ Billions or $ Millions) Product: Xyrem Xywav Epidiolex Rylaze Sunosi Zepzelca JZP-385 JZP-150 Patient Population: 165K 175K 165K 175K ~6K new cases / year 165K 175K 25K 30K new / year 95K 100K ~7 million ~2 million Peak Penetration Rate: 6.3% (FY 21) 6.5% (FY 25) 55% (FY 27) 10% (FY 24) 25% (FY 25) 40% (FY 25) 8% (FY 27) 35% (FY 28) Generics Entrance: FY 25 FY 28 N/A N/A N/A N/A N/A N/A Average Price per Patient: $130K $160K $110K $125K $35K $55K $55K $67K $400K+ $8K $12K $1K $2K $1K $2K Pre-Generic Price Increases: ~6% ~2% ~5% ~1% ~9% ~2% ~3% ~3% Peak Sales (Projected): $245 million $509 million $687 million $796 million $993 million $1.4 billion $1.3 billion $2.5 billion Goldman Stanley 6 (1) Per management estimates from 8/3 meeting.
Project Jaguar POTENTIAL STRATEGIC ALTERNATIVES Criteria for Potential Strategic Partners Goldman Stanley Considered a Broad Range of Potential Biopharma Partners Size, Ability to Pay, Product Pipeline, and Strategic Fit Should All Be Considered At $200 / share, Jaguar would be worth an Enterprise Value of over $18 billion; potential partners should be able to use $18 billion in combined Cash and Debt to fund a potential deal Key Criteria Both branded and generics companies should be considered, given recent M&A activity Tier 1 Potential Partners Tier 2 Potential Partners Significantly larger than Jaguar Closer to Jaguar s size Market Cap Capable of paying at least $18- 20 billion in Cash and Debt May have to issue Stock to fund the full purchase price Ability to Pay Solid product and pipeline fit Solid product and pipeline fit Strategic Fit Goldman Stanley 7
Project Jaguar JAGUAR VALUATION Jaguar WACC Analysis Based on Jaguar s Historical Beta and Capital Structure and Comparable Companies(1) Goldman Stanley reviewed Jaguar s historical data and information from the comparable companies: Given the wide differences in capital structures, it is crucial to calculate WACC via multiple methods The DCF assumes an initial WACC of 7.0% declining to 5.4% by Year 10, based on WACC figures in the 6.5% 8.5% range for Jaguar s higher-growth peers The final 5.4% rate in the Terminal Period is close to the average WACC produced by the three methods described here ($ USD in Billions) WACC Calculation Assumption Notes Low Base High Equity Risk Premium Duff & Phelps Valuation Handbook (2021) 5.5% 5.5% 5.5% Risk-Free Rate 10-year U.S. Treasury Yield as of 8/31/2020 1.3% 1.3% 1.3% Jaguar historical Beta and re-levered Beta from the comparable companies Levered Beta 0.78 0.97 1.35 Cost of Equity (Ke) Based on Capital Asset Pricing Model (CAPM) 5.6% 6.6% 8.7% Current capital structure and optimal capital structure from comps median Equity / Total Capitalization 96.6% 52.2% 52.2% Weighted YTM of Jaguar s current Debt, including Convertible Bonds Pre-Tax Cost of Debt 3.1% 3.1% 3.1% U.S. corporate tax rate + international benefits Tax Rate (T) 15.0% 15.0% 15.0% After-Tax Cost of Debt (Kd) 2.6% 2.6% 2.6% Current balance or comparables median Debt percentage Total Debt (D) $0.5 B $7.6 B $7.6 B Total Capitalization Jaguar current Debt + Equity Value $15.9 B $15.9 B $15.9 B Current capital structure and optimal capital structure from comps median Debt / Total Capitalization 3.4% 47.8% 47.8% WACC Ke * E / (D + E) + Kd * (1 T) * D / (D + E) 4.7% 5.5% 5.8% Goldman Stanley 8 (1) Market data based on closing prices as of 8/31/2021.
Calibri Slide Title 24 Content/Section Title Text 14 Bullet, Subtitle, and Main Paragraph Text 12 Table, Chart, Profile, and Currency Text 10 Full Dates on Charts 9 Footnotes 8 Normal shapes w/ text Outline: black, pt. 204 209 215 72 80 89 94 124 158 17 61 99 9