Supervised Learning II - Linear Decision Planes Approach
Today's lecture focuses on supervised learning with topics including linear decision plane approach, support vector machine classifier, and cross-validation. The session elaborates on the use of the native iris dataset in R for practical demonstrations. The recap covers the introduction to the supervised learning problem and the concept of K-nearest neighbors. Examples and illustrations help in understanding the application of linear decision planes in classification tasks.
Download Presentation

Please find below an Image/Link to download the presentation.
The content on the website is provided AS IS for your information and personal use only. It may not be sold, licensed, or shared on other websites without obtaining consent from the author.If you encounter any issues during the download, it is possible that the publisher has removed the file from their server.
You are allowed to download the files provided on this website for personal or commercial use, subject to the condition that they are used lawfully. All files are the property of their respective owners.
The content on the website is provided AS IS for your information and personal use only. It may not be sold, licensed, or shared on other websites without obtaining consent from the author.
E N D
Presentation Transcript
BUSQOM 1080 Supervised Learning II Fall 2020 Lecture 22 Professor: Michael Hamilton Lecture 22 Supervised Learning II
Lecture Summary Today: More on supervised learning 1. Linear decision plane approach to Supervised Learning. [5 Mins] 2. Support Vector Machine Classifier [10 Mins] 3. Cross validation for fitting the parameters of the method [10 Mins] Lecture 22 Supervised Learning II
Data for lecture Let s stick with the native iris dataset in R data = iris Lecture 22 Supervised Learning II
Recap: Introduction to Sup. Learning Problem: Given a training set of labelled observations, want to be able to predict the labels of new observations in the test set Example: In iris dataset, given observations of flowers belonging to Setosa, Versicolor, and Virginica. Given a new observation of a flower, can we classify it s species? Lecture 22 Supervised Learning II
Recap: K Nearest Neighbors Idea: Reason about each point by looking at how similar points are labeled. Algorithm: For each test point t, let x1, , xk be k points in the training set that minimize (tj xij)2 i.e. the Euclidean distance. Let M(S) be function that takes in sets of obs. S, and outputs the most common label among the set. Assign t label M(x1, , xk) Lecture 22 Supervised Learning II
Example: Oranges and Lemons t s four nearest neighbors are: Majority label is Lemon Goal: Classify new point as orange or lemon. Algo: Examine neighbors, classify point as major label t Lecture 22 Supervised Learning II
Linear Decision Planes K Nearest Neighbors can t easily pick up on structure in the data. For this new test point, of it s three nearest neighbors, two are blue and one is red. But clearly it should be classified as red Lecture 22 Supervised Learning II
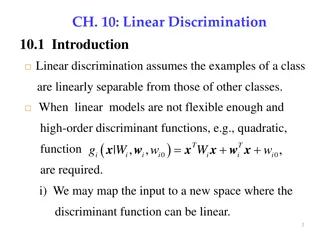
Linear Decision Planes Idea: Find separating hyperplanes (lines) of the data New points are classified as red if they fall to the left of the line. Otherwise they are classified as blue Lecture 22 Supervised Learning II
Linear Decision Planes Idea: Find separating hyperplanes (lines) of the data How do we find the best separating line? Lecture 22 Supervised Learning II
Linear Decision Planes Idea: Find separating hyperplanes (lines) of the data Further, what do we do when no plane can separate all the data? Lecture 22 Supervised Learning II
Support Vector Machine Idea: Try to correctly label as many as possible by minimizing a function to classify points by drawing decision plane through the data. The best line is the one that splits the middle between points in space. By splitting middle, we mean the line maximizes the distance between the decision plane and the correctly classified points If a line correctly labels all points, we call the data linearly separable Lecture 22 Supervised Learning II
Support Vector Machine vs Regression Note in regression, we were trying to find a line that minimized the sum of the distances from the points. SVM essentially does the opposite, it tries to find the line that maximizes the distance of each correctly classified point from the line. Lecture 22 Supervised Learning II
Support Vector Machine in R Lets try and classify setosa flowers vs virginica flowers. >install.packages("e1071") >library(e1071) > data = iris[iris$Species %in% c("setosa", "virginica"),] > shuffled.data = data[sample(length(data[,1])),] > model = svm(Species ~ Petal.Length + Petal.Width, kernel = "linear", data = shuffled.data[1:70,]) > predicted.labels = predict(model, shuffled.data[71:100,3:4]) Lecture 22 Supervised Learning II
Support Vector Machine in R > model = svm(Species ~ Petal.Length + Petal.Width, kernel = "linear", data = shuffled.data[1:70,]) Linear Equation just like in regression Testing DataFrame Tells R to learn a linear decision plane > plot(model, shuffled.data[1:70,], Petal.Length ~ Petal.Width) Lecture 22 Supervised Learning II
Support Vector Machine in R We don t have to learn lines, there are support vector curves that can better separate data. Example: Quadratic Decision Boundary Lecture 22 Supervised Learning II
Nonlinear Support Vector Machine in R > model = svm(Species ~ Petal.Length + Petal.Width, kernel = radial", data = shuffled.data[1:70,]) > plot(model, shuffled.data[1:70,], Petal.Length ~ Petal.Width) Other kernels: sigmoid , polynomial Lecture 22 Supervised Learning II
K Fold Cross Validation Problem: Given a training set of labelled observations, we want to fit the parameters of our model in a way that is generalizable We just use the given training set, it s possible there is special structure in the training set that biases us to learn parameters that over fit that special structure. Idea: Break up training data into pieces, learn model parameters by averaging over all the ways we slice up the training data. Lecture 22 Supervised Learning II
K Fold Cross Validation Cross Validation is a technique for learning parameters generalizably. Each observation in the data sample is assigned to an individual group and stays in that group for the duration of the procedure. This means that each sample is given the opportunity to be used in the hold out set 1 time and used to train the model k-1 times. Steps: 1. Shuffle the dataset randomly. 2. Split the dataset into k groups 3. For each unique group: Take the group as a hold out or test data set Take the remaining groups as a training data set Fit a model on the training set and evaluate it on the test set Retain the evaluation score and discard the model Summarize the skill of the model using the sample of model evaluation scores Lecture 22 Supervised Learning II
K Fold Cross Validation Going back to kNN for a moment: Suppose our training set was 100 random observations and we wanted to learn how good a choice of k was. Fix some number of neighbors to consider (k =3 maybe) Break training set into five groups of 20 (5-Fold Cross Validation) Round 1: Training set equals the first 4 groups of 80 obs, test set equals last group of 20 obs. Check all k, average and save prediction accuracy for this partition of the data Repeat! After 5 (since it s 5-Fold) rounds, average the prediction accuracies for using 3 neighbors and treat that as the generalizable prediction of that choice of neighbors considered. Lecture 22 Supervised Learning II
K Fold Cross Validation in R (no packages) Lecture 22 Supervised Learning II
K Fold Cross Validation in R Let s find the best k <20 using our brand new crossval() function Lecture 22 Supervised Learning II
Final Thoughts on Supervised Learning We saw three methodologies: Logistic Regression, kNN, and SVM. There are many many more ways to do classification, the most prominent of which is using Neural Nets (NN)! Learning how to train and use a Neural Net would be something very nice to try out on your final project! When doing classification and choosing your methodology, don t be afraid to try out a whole bunch and keep what works! Different methods work for different problems, it s fine to experiment until you find a method that works well on your data! Lecture 22 Supervised Learning II
