Stochastic Storm Transposition in HEC-HMS: Modern Techniques and Applications
Explore the innovative methods and practical applications of Stochastic Storm Transposition (SST) in the context of HEC-HMS. Delve into the history, fundamentals, simulation procedures, and benefits of using SST for watershed-averaged precipitation frequency analysis. Learn about the non-parametric space-for-time substitution approach, data-driven techniques, and how to simulate SST with equal probability for enhanced hydrologic modeling.
Download Presentation

Please find below an Image/Link to download the presentation.
The content on the website is provided AS IS for your information and personal use only. It may not be sold, licensed, or shared on other websites without obtaining consent from the author.If you encounter any issues during the download, it is possible that the publisher has removed the file from their server.
You are allowed to download the files provided on this website for personal or commercial use, subject to the condition that they are used lawfully. All files are the property of their respective owners.
The content on the website is provided AS IS for your information and personal use only. It may not be sold, licensed, or shared on other websites without obtaining consent from the author.
E N D
Presentation Transcript
Stochastic Storm Transposition in HEC-HMS HEC-HMS Quarterly Webinar FY23 Q4 Greg Karlovits USACE Hydrologic Engineering Center
Outline 1. Modern SST fundamentals 2. Doing SST in HEC-HMS (v4.11 walkthrough) 3. Ongoing and future development (v4.12 and beyond)
Modern SST Fundamentals Stochastic Storm Transposition
SST: A Brief History 1962: GN Alexander proposed the idea. 1996: Franchini et al. showed that SST could be used for flood frequency using a coupled model (but was again limited by only using the USACE catalog.) 1989: Foufoula-Georgiou put most of the math together to show that it was reasonable, but its application was oriented towards idealized versions of the extreme storms in the USACE catalog for assessing extreme quantiles of precipitation. This is considered the first SST paper. 2012-2014: Wright et al. put out a series of papers showing what we can do with radar and multisensor precipitation data and that SST works for both precipitation and flood frequency. 1990: Wilson and Foufoula-Georgiou gave it a practical attempt with elliptical storm patterns fit to the USACE catalog storms. 2020: Holman, Wright, and Yu implement a quasi-continuous framework to capture hydrologic uncertainty
Modern SST in a Nutshell Identify a region of similar heavy precipitation mechanics Collect data for all the important storms in the region Move them around that region at random See how the precipitation interacts with your watershed
Stochastic Storm Transposition (SST) Non-parametric space-for-time substitution Resample severe storm events from a catalog Preserve properties of real storms Develop watershed-average precipitation- frequency Transpose multiple storms per year Use a data-driven approach to reduce assumptions Wright, Smith, and Baeck (2013)
SST Simulation Procedure Select a storm from the catalog with equal probability Transpose to new location within the domain with equal probability Get information from the transposition Compute watershed-averaged precipitation Run a hydrologic model Wright, Yu, and England (2020)
Monte Carlo simulation: If brute force doesn t work, you aren t using enough. Sherrilyn Kenyon SST Simulation Structure Repeat 0..n times for each year of simulation n usually Poisson-distributed Mean rate determined by catalog Extract annual maxima Repeat 1..S times for a realization of simulation S controls the rarest frequency that can be estimated (usually at least 1,000) Repeat 1..R times R controls how well knowledge uncertainty is described 1,000 years with = 10
Storms Fine resolution representation of severe historical events Drawn from a meteorologically homogenous region around the watershed Worst storms for the watershed Collection of rasterized rainfall for each timestep Multiple events per year Top ranked events, or events that exceed a threshold Data: Kitzmiller et al. (2018) Viz: Dewberry
All Storms Over 3.491 in *threshold to get an average of 10 events / year
4 Transpositions, 1 Storm Accumulation Hourly
Fundamental Assumptions Transposition domain Storms can be freely transposed from anywhere to anywhere else in the domain Representative data Data adequately captures the rainfall that occurred Catalog is representative Storms collected in catalog are sufficient for describing the hazard 10,000 random transposition positions
USDA Getting to Flood Frequency Quasi-continuous hydrologic modeling Initialize model with seasonally-dependent parameters Generate conditions based on historical simulation Capture variability in key state parameters Soil moisture Snowpack Channel flow Reservoirs etc. Yu, Wright, and Holman (2021)
Sample Results (One Realization) A14 basin-average point estimates Conventional Clark unit hydrograph
Credits HEC-HMS Team Tom Brauer Daniel Black Lauren Coe Paul Ely Collaborators FEMA Future of Flood Risk Data Initiative Dewberry Dr. Daniel Wright (University of Wisconsin)
Getting a Storm Catalog 1. Determine the transposition domain 2. Identify storm events 1. Largest 72-hour events when maximized for the watershed 2. Top 5-15 events per year 1. Choose a threshold value for average precip 2. Target a rate Actual Location Maximized
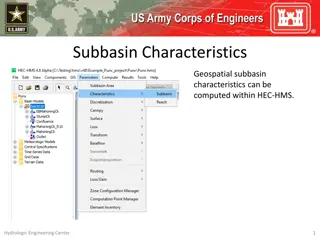
Basin Model Setup depends on goal For watershed-averaged precipitation-frequency: One subbasin HEC-HMS GIS features make multiple delineation arrangements easy! For flow frequency analysis: Multiple subbasins
One Subbasin Delineate above the point of interest Only use a discretization method (no processes)
Multiple Subbasins Set your model up as you would normally
Meteorologic Model Use Gridded Precipitation method New feature options Time shift method Transpose option X and Y coordinate Bias grid
Shared Data Components (Grids) One grid per storm Cumbersome to manually import Current practice is to write a new .grid file using Python Plan to facilitate this in the future
.grid File Plaintext file that locates your HEC-HMS project grid data
Shared Data Components (Paired Data) Storm names as Parameter Value Samples Must match names in the precipitation grids
Coordinates in Non-Rectangular Domain Generate points in GIS Import them as paired data Use the new Specified Values Random (Same Index) sampler QGIS
Uncertainty Analysis Number of samples Storms per year * number of storms Time window Just make it long enough Handled by time normalization
Uncertainty Analysis Analysis points Subbasin precipitation for precipitation-frequency analysis Outflow for flow- frequency analysis
Uncertainty Analysis Minimum three parameters: Gridded Precipitation X Coordinate Gridded Precipitation Y Coordinate Gridded Precipitation Grid Name Hydrologic parameter uncertainty Note: non-numeric parameters in Uncertainty Analysis is new as of 4.11
Dealing with Results Multiple transpositions per year in simulation These storms are NOT annual maximum events Need to pull out the annual maximum precipitation/flow to get AEPs
Uncertainty vs. Optimization Uncertainty analysis gives you a frequency response Evaluate response for huge combination of storms and positions Rank them to find frequency of the response Optimization gives you a worst-case scenario The upper bound for SST is the most severe storm optimized for location over the watershed Optimized events only have a frequency when you consider the full range of uncertainty
Ongoing and Future Development
Some Relevant Upcoming Features Variable parameter Mod Clark transform Parallelization of uncertainty analysis Enhancements to hydrologic model starting state sampling Random event date Extracting starting states from continuous simulation Specified value-same index random sampling Management of simulation and results R&D work unit
Variable Parameter ModClark Currently in v4.12-alpha Variable-parameter Clark + ModClark Allows use of excess-varying tc and R with ModClark Why? Allows you to get to nonlinear runoff response with unit hydrograph Capturing non-linearity is crucial for frequency analysis applications
Parallelization of Uncertainty Analysis In development for v4.12 Small UI changes (new progress bar) Huge performance gains
Random Event Date In development for v4.12 Allow each event in an Uncertainty Analysis to occur at a different time in the year Allows sampling seasonal parameters
Start States from Continuous Simulation Post v4.12 States from a continuous sim as initial conditions Initial deficit Initial SWE Reach discharge Reservoir stage Canopy/surface storage etc. Little tweaks under development to make this easier
Specified Value Random (Same Index) Currently in v4.12-alpha Allows groups of parameters when sampled from lists Parameter 1 Parameter 2 Param 1 Value 1 Param 2 Value 1 Param 1 Value 2 Param 2 Value 2 Param 1 Value 3 Param 2 Value 3 Param 1 Value 4 Param 2 Value 4 Param 1 Value 5 Param 2 Value 5
Simulation/Results Management Long-term plan Allow user to define: Events per year Years per realization Number of realizations Handle and plot results appropriately
R&D Work Unit (FCS) Improved Hydrologic Modeling of Probabilistic Storms Primarily aimed at providing frequency storm modeling guidance Area reduction factors for point-precipitation products Temporal/spatial patterns Uncertainty quantification Model parameterization/calibration for frequency modeling SST will play a central role Plan to develop tools for storm catalog generation
