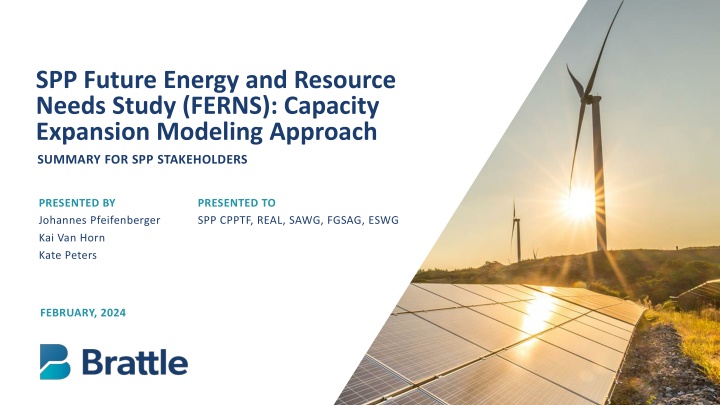
SPP Future Energy and Resource Needs Study Summary
Capacity expansion modeling approach outlined in the SPP Future Energy and Resource Needs Study (FERNS). The study focuses on determining the most cost-effective future resource mix to meet system needs through 2050 under various electrification and carbon-free generation pathways. It addresses questions related to system costs, resource adequacy frameworks, load management impacts, and more. The study includes scenario-specific questions and definitions, modeling different levels of electrification and decarbonization. By analyzing different renewable generation shares and system electrification scenarios, the study aims to provide insights into future system costs and reliability challenges. The study will focus on three periods (2020s, 2030s, and 2040s) to capture the non-linear impacts of renewable development and electrification, modeling select years through 2050.

Download Presentation

Please find below an Image/Link to download the presentation.
The content on the website is provided AS IS for your information and personal use only. It may not be sold, licensed, or shared on other websites without obtaining consent from the author. If you encounter any issues during the download, it is possible that the publisher has removed the file from their server.
You are allowed to download the files provided on this website for personal or commercial use, subject to the condition that they are used lawfully. All files are the property of their respective owners.
The content on the website is provided AS IS for your information and personal use only. It may not be sold, licensed, or shared on other websites without obtaining consent from the author.
E N D
Presentation Transcript
SPP Future Energy and Resource Needs Study (FERNS): Capacity Expansion Modeling Approach SUMMARY FOR SPP STAKEHOLDERS PRESENTED BY Johannes Pfeifenberger Kai Van Horn Kate Peters PRESENTED TO SPP CPPTF, REAL, SAWG, FGSAG, ESWG FEBRUARY, 2024
Preliminary draft. Main Study Questions FERNS Capacity Expansion Modeling What is the most cost effective future resource mix to meet system needs through 2050 under a range of electrification and carbon free generation pathways? How do the costs (operational and investment) of these systems vary across future scenarios? What are the shortcomings of the current resource adequacy framework in a highly electrified and decarbonized future? How could load management (e.g. through demand response) impact reliability and system costs in a high electrification future? We will answer these questions by running GridSIM under the SPP-specified scenarios through 2050 for SPP and the surrounding areas. The results from our expansion planning simulations can then be tested through SPP economic (nodal) and resource adequacy simulations. Brattle has been coordinating with CPPTF, SPP Transmission, SPP Policy, and other groups to ensure modeling approach is consistent with SPP planning studies. SPP has the option to utilize the expansion planning results for CPP and other efforts.
Preliminary draft. Scenario Specific Questions and Definitions Additional study questions will be answered by modeling 5 core scenarios with varying levels of electrification and decarbonization, plus potential sensitivities What are the resource adequacy and resilience challenges in these scenarios? How can alternate resource adequacy frameworks impact the costs to procure a reliable resource mix? (All) How do the future system costs vary under different renewable generation shares and system electrification scenarios? Under high renewable shares /high system electrification, as a high bookend? (B3) Under moderate renewable shares and low system electrification, as a low bookend? (A1) How do they rank between the bookends? (A2, B1, B2) How can load management strategies support reliability and mitigate system costs in highly electric and decarbonized future markets? (B3 w/ sensitivity) Electrification and carbon-free resource shares will be pre-determined in each scenario Hourly demand will be consistent with the three FERNS Demand Electrification Modeling scenarios Carbon-free resource scenarios will be based on federal, state, and SPP member policies with moderate only including existing mandates and high also including new and aspirational goals FERNS Study Scenarios Carbon Free Resource Shares Low Moderate High Electrification Low A1 B1 Moderate A2 B2 High B3 Source: FERNS scenario narrative This study will focus on three periods: 2020s, 2030s, and 2040s to capture the non-linear system impacts of renewable development and electrification. We will model select years through 2050, consistent with the FERNS low/moderate/high electrification load forecasts: 2023, 2025, 2029, 2034, 2040, 2050.
Preliminary draft. Zonal Topology and Transmission Limits Proposed Zones for FERNS Study GridSIM uses a pipe-and-bubble representation of the SPP footprint, aggregating generators and loads into a multi-zonal energy model We propose to model 6 zones in SPP, consistent with the 2023 Draft LOLE zones, aggregated up from transmission pricing zones North, North Central, Central East, Central West, Southeast, Southwest The southern and central zones are split between east and west to capture congestion and transmission needs between the renewable-rich load-rich portion of these zones North (UMZ) North Central (LES, OPPD, NPPD) Central West (MIDW, SUNC) Central East (EMDE, GMO, KACY, KCPL, WEST, SPICUT) South East (AEP, GRDA, OKGE, SWPA, WFEC) South West (SWPS) Zones allow us to capture congestion, which requires the definition of inter-zonal transmission limits, and (optional) expansion costs SPP inter-zonal transmission limits from SPP 2023 LOLE study between each zone and the rest of SPP that define forward and reverse flow limits We propose to allow the model to economically expand the transmission limits between zones (co-optimized with building resources within the zones to achieve lowest total costs) Base map source: SPP
Preliminary draft. Zonal Loads, Generation, and Internal Transmission Limits Modeled SPP Transmission Zones SPP load data from FERNS Demand Electrification Modeling scenarios for 15 weather years Existing generator data (Integrated Transmission Planning 2024) will be aggregated into the 6 zones shown at right Will include already-planned generation additions and retirements (e.g., through 2030) as model input; model-based economic decisions after that North Bi-directional interface Constraints Import/export interface limits sourced from 2023 LOLE study, between each zone and the SPP system Simultaneous transmission export/import limits constrain hourly energy flows between zone Based on zonal export/import limits used in 2023 LOLE study Inter-zonal transmission constraints can create congestion and price differences in the model, limiting generation expansion, showing needs for additional zonal resources, or inter-zonal transmission capacity North Central Central East Zonal import/export limits ones can be expanded based on proxy ($/MW) expansion costs Expansion costs will be sourced from SPP transmission teams and public studies Central West Renewable costs, generation profiles, and technical potential will vary by zone Renewable profiles will be weather consistent with 15 years of load data and vary by zone, to capture renewable drought variability in SPP footprint Increasing zonal transmission/interconnection costs at higher renewable shares will be sourced from SPP generation interconnection studies and modeled as increasing transmission cost adders to renewable generation supply curves South West South East
Preliminary draft. SPP Zones and Interties to Neighboring Systems External Zonal Topology Canada External interties and limits In addition to the internal SPP zones, we propose to model the interties for up to 8 external zones with variable hourly transmission flows to/from SPP to capture the economic and resilience benefit interregional diversity SPP West RTO (Interties: Sidney, Stegall, Miles City, Rapid City) North Bi-directional interface Constraints Intertie limits provided by SPP in import and export direction (possibly use pro-rata allocation to interconnected SPP zones) MISO North North Central Each external zone will be modeled with simplified aggregate load and resources, but reflecting differences net-load variance to capture geographic diversity. Central East Central West Colorado (Lamar intertie) Future expansions of external resource capacity and transmission capabilities will be an input assumption (i.e., not optimized by the model) Load and resource mix to evolve consistent with FERNS scenarios, based on data from NREL studies (Cambium) MISO South South West South East New Mexico (Interties: Blackwater, Eddy) How do stakeholders anticipate the existing intertie capacities will increase? ERCOT
Preliminary draft. Resource Adequacy Approach Example: Hourly Wind Profiles (March 2020 Week in North and Southwest Regions) Conventional approach to considering resource adequacy in expansion modeling: Based on forecasted normalized summer peaks plus planning reserve margins Capacity accreditations based on ELCC values (specified as a function of resource shares) Southwest North Challenge: requires a lot of assumptions (about the nature of future resource adequacy challenges, ELCCs, and planning reserve margin) that will change significantly in an increasingly decarbonized and electrified future Proposed dynamic approach to resource adequacy Create a proxy weather year based on load and renewable data for 15 weather years to approximate the expected future challenges SPP may experience Heat waves, cold snaps, renewable droughts Realistic seasonal, daily, hourly variations Day 1 Day 2 Day 3 Day 4 Day 5 Day 6 Day 7 Example: Hourly Solar Profiles (March 2020 Week in North and Southwest Regions) Each year will be represented by 20+ three-day periods that capture representative conditions across all available weather years. Each 3-day period has a different probabilistic weight consistent with 8760 hours in 15 weather years Southwest The simulation will balance supply and demand in every hour, including operating reserve requirements. This will identify when resource adequacy challenges will occur in the future Future risk likely concentrated in certain months/hours outside of summer peaks The model will chose generation investments and technologies capable of meeting needs North The results will inform when the existing RA frameworks may need to be modified in the future (but will need to be confirmed through probabilistic LOLE analyses with SERVM) Day 1 Day 2 Day 3 Day 4 Day 5 Day 6 Day 7 Renewable profile shown for a sample week in March 2020 to highlight hourly and geographic variation in the 15 year dataset.
Preliminary draft. Summary of Modeling Inputs Data Element Description and Source Notes (may differ by year modeled) Transmission Modeling Inputs Energy Zones Six internal energy zones consistent with 2023 LOLE Study zones Transmission Topology And Limits Interface limits between each internal zone and the rest of SPP consistent with 2023 LOLE study limits Import and export limits based on SPP documentation. Hourly transfer capability based on simplified modeling of external zones to capture regional variations in load, renewables for potential SPP diversity benefits. Imports and Exports Demand-Side Modeling Inputs Load Growth Baseline, IRA, and Central scenarios developed by EER for SPP FERNS Demand Electrification that represents a range of electrification scenarios Hourly Load Shapes Hourly shapes developed by EER for SPP FERNS Demand Electrification that vary by (weather) year, region, end-use, and scenario for 2023, 2025, 2029, 2034, 2040, 2050 Supply-Side Modeling Inputs Existing Generator Data SPP data (ITP, 2024) for existing unit capacities, heat rates, and additional operational characteristics by region Scheduled Additions/Retirements (near term) SPP data (ITP, 2024)or Velocity Suite, ABB Inc. and public announcements for near-term plant developments and retirements (capacity, location, date) to force into the model Capital, fixed, and variable cost projections for new generators by resource type and zone from SPP IHS forecasts (if available for use in FERNS study), otherwise will source from NREL Annual Technology; zonal costs and intra-zonal transmission adders as function of resource availability and transmission headroom/cost by zone informed by SPP interconnection studies Cost Trajectory for New Gen by Zone Hourly Renewable Output by Zone Hourly renewable profiles for all SPP and external zones, for all weather years available in the load dataset, available through Imperial College London (renewables.ninja) Natural gas prices from SPP IHS forecasts and sensitivities used in 2024 and 2025 ITP parameters (if available for use in FERNS study), otherwise will source from S&P Global and other public sources Fuel Prices by Zone Market and Policy Inputs The conventional approach would be to mode normalized peak loads plus planning reserve margin and capacity accreditations based on ELCC values (specified as a function of resource shares). Given that we expect the current RA framework won't be adequate in the future, we propose modeling an alternative approach to procure capacity based on hourly energy needs given load and renewable weather variability. This approach will be able to identify dynamically the specific times of the year and hours of the day that give rise to RA challenges in the future modeling proxy weather years with heat waves, cold snap, renewable droughts etc. Reserve Margin/RA framework Clean Energy Policies Carbon-free resource scenarios will be based on federal, state, and SPP member policies with moderate only including existing mandates with high including new and aspirational policies Tax Credits IRA-based PTC for solar and onshore wind and ITC for OSW and battery storage, assumed extended through study horizon
Preliminary draft. Appendix
GridSIM: Brattles capacity expansion model Basics Optimization model that minimizes system investment and operation costs, providing optimized power system build-out and dispatch for given scenario conditions Co-optimized modeling and pricing of energy and RA markets (with endogenous inter-zonal transmission optimization) Zonal representation of SPP system, transmission limits, and resource adequacy constraints mimic power systems and markets Chronological commitment and dispatch to model storage and demand response; representative days with hourly detail, including option to include multiple days with challenging system conditions (heatwaves, coldsnap, renewable drought). Models any applicable decarbonization policies in a variety of ways, via clean energy goals requirements, technology mandates, and/or carbon prices Outputs Least-cost capacity expansion, retirement, and dispatch to meet demand for energy/capacity subject to environmental and transmission constraints System costs Market prices for energy, RA, emissions, etc. Emissions Resource adequacy information Brattle owning of the code enables great flexibility for tuning the model to the needs of each study and market (market design, constraint specifications, algorithms, input structures, output content, etc.)
Preliminary draft. GridSIM Inputs, Optimization and Constraints, and Outputs INPUTS GridSIM OPTIMIZATION ENGINE OUTPUTS Supply Objective Function Annual Investments and Retirements (optional transmission expansion) Minimize NPV of Investment & Operational Costs Existing resources Fuel prices Investment/fixed costs Variable costs Demand Representative days (hourly chronology) Capacity needs Hourly Operations Transmission Zonal limits Intertie limits (and expansion costs) Constraints Market Design and Co-Optimized Operations Market Shadow Prices (Energy and resource adequacy) Capacity Energy Regulatory & Policy Constraints Resource Operational Constraints Transmission Constraints Regulations, Policies, Market Design Capacity market Carbon pricing State energy policies and procurement mandates Emissions and Clean Energy Additions