Social Statistics: Linear regression
Application of linear regression in social and behavioral sciences for accurate predictions and judgment of accuracy. Learn about correlation, logic of prediction, types of regression, and excel implementation. Dive into an example of predicting first-year college GPA from high school GPA using regression analysis. Discover how to interpret regression lines, Excel functions for slope and intercept, and evaluate prediction accuracy with error estimation

Download Presentation

Please find below an Image/Link to download the presentation.
The content on the website is provided AS IS for your information and personal use only. It may not be sold, licensed, or shared on other websites without obtaining consent from the author.If you encounter any issues during the download, it is possible that the publisher has removed the file from their server.
You are allowed to download the files provided on this website for personal or commercial use, subject to the condition that they are used lawfully. All files are the property of their respective owners.
The content on the website is provided AS IS for your information and personal use only. It may not be sold, licensed, or shared on other websites without obtaining consent from the author.
E N D
Presentation Transcript
This week How to predict and how it can be used in the social and behavioral sciences How to judge the accuracy of predictions INTERCEPT and SLOPE functions Multiple regression 2
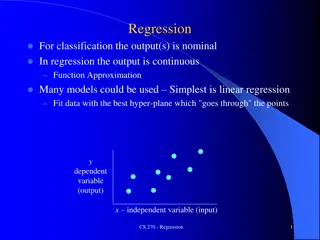
Prediction Based on the correlation, you can predict the value of one variable from the value of another. Based on the previously collected data, calculate the correlation between these two variable, use that correlation and the value of X to predict Y The higher the absolute value of the correlation coefficient, the more accurate the prediction is of one variable from the other based on that correlation 3
Logic of prediction Prediction is an activity that computes future outcomes from present ones. When we want to predict one variable from another, we need to first compute the correlation between the two variables 4
Type of regression Linear regression One independent variable Multi-independent variables Non-linear regression Power Exponential Quadric Cubic etc = x 1 + a y a ax + 1 b x = + + + ... y a x b 2 2 n n y = y = b ax xe = = + + + 2 2 y y ax ax bx bx c + + 3 cx d 5
Example 4 high school GPA First-year college GPA 3.5 3.5 2.5 3.3 2.2 3.5 2.7 3.5 First-year college GPA 3 4 2.5 3.8 2.8 1.9 3.2 3.7 2.7 3.3 2 2 1.5 3.1 3.4 1.9 3.7 1 0.5 0 0 1 2 3 4 5 High Schol GPA Regression line, line of best fit Y = bX + a 6
Regression line Y = bX + a X ( ( / ) XY Y n = b 2 2 ) / X X n a = Y b X n Y = 0.704X + 0.719 Y (read Y prime) is the predicted value of Y 7
Excel Y = bX + a b = SLOPE(known_y's,known_x's) a = INTERCEPT(known_y's,known_x's) high school GPA First-year college GPA 3.5 2.5 3.3 2.2 3.5 2.7 3.5 4 3.8 2.8 1.9 3.2 3.7 2.7 3.3 2 3.1 3.4 1.9 3.7 Slope (b) intercept (a) 0.703893443 0.71977459 actual value predicted value 3.25 3.007428279 8
How good is our predication Error of estimate Standard error of estimate The difference between the predicated Y and real Y Standard error of estimate is very similar to the standard deviation. 9
Example You are a talent scout looking for new boxers to train. For a group of 6 pro boxers, you record their reach (inches) and the percentage of wins (wins/total*100) over his career. Create a regression equation to predict the success of a boxer given his reach 10
Example Boxer A B C D E Reach(X) 68 80 76 82 65 Win-p(Y) 40 85 64 94 30 11
Example Making predictions from our equation What winning percentage would you predict for T-rex Arms Timmy, who has a reach of 62-inches We would predict 18.44% of Timmy s fights to be wins 12
Example Making predictions from our equation What winning percentage would you predict for Ape-Arms Al, who has a reach of 84-inches? We would predict 98.08% of Al s fights to be wins 13
Exercise For a variety of reasons, a larger percentage of people are concerned today about the state of the environment than in years past. This has led to the formation of environmental action groups that attempt to alter environmental policies nationally and around the globe. A large number of environmental action groups subsist on the donations of concerned citizens. Based on the following eight countries, examine the data to determine the extent of the relationship between simply being concerned about the environment and actually giving money to environmental groups. Could you construct a scatterplot of the two variables, placing Percentage Concerned as X-axis and Percentage Donating Money as Y-axis? Does the relationship between the two variables seem linear? Could you model it? Find the value of the Pearson correlation coefficient that measures the association between the two variables and offer an interpretation. 15
Exercise Country Austria Denmark Netherlands Philippines Russia Slovenia Spain United States Source: International Social Survey Programme, 2000. Percentage Concerned Percentage Donating Money 35.5 27.2 30.1 50.1 29 50.3 35.9 33.8 27.8 22.3 44.8 6.8 1.6 10.7 7.4 22.8 16