Sine and Cosine Functions in Graphs
Exploring the unit circle to find values of sine at different angles, understanding periodic functions, and graphing sine and cosine functions with variations in amplitude and periods. Learn about vocabulary related to sin waves, amplitude, and period, and discover how to sketch the graph of y = sin(x) by locating key points. Dive into the continuous nature of the sine function, its symmetry, x-intercepts, and period. Understand the concept of amplitude in sine and cosine functions and how it affects the graph vertically.

Download Presentation

Please find below an Image/Link to download the presentation.
The content on the website is provided AS IS for your information and personal use only. It may not be sold, licensed, or shared on other websites without obtaining consent from the author.If you encounter any issues during the download, it is possible that the publisher has removed the file from their server.
You are allowed to download the files provided on this website for personal or commercial use, subject to the condition that they are used lawfully. All files are the property of their respective owners.
The content on the website is provided AS IS for your information and personal use only. It may not be sold, licensed, or shared on other websites without obtaining consent from the author.
E N D
Presentation Transcript
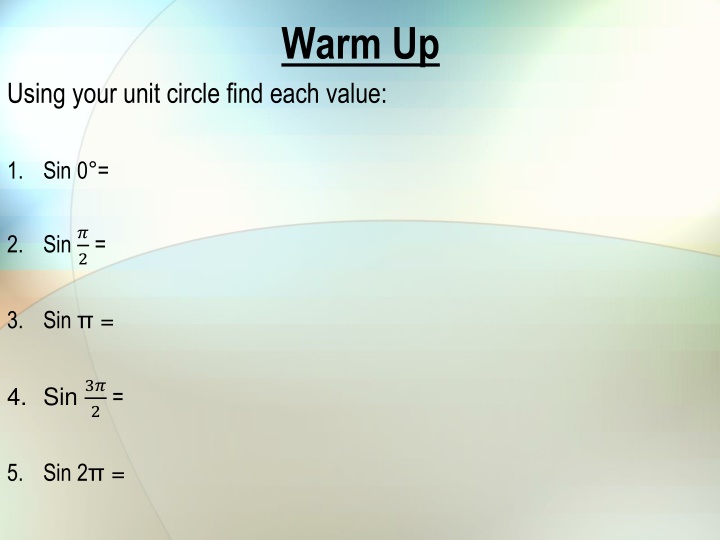
Warm Up Using your unit circle find each value: 1. Sin 0 = 2. Sin ? 2= 3. Sin = 4. Sin 3? 2= 5. Sin 2 =
Chapter 4 Chapter 4 Graphs of the Circular Functions Section 4.1 Graphs of the Sine and Cosine Functions Objective: SWBAT graph the sine and cosine functions with variations in amplitude and periods.
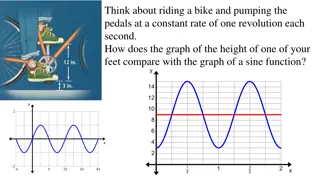
Periodic Functions Many things in daily life repeat with a predictable pattern, such as weather, tides, and hours of daylight. This periodic graph represents a normal heartbeat. A function that repeats itself after a specific period of time is called a Periodic Function. Sine and Cosine functions are periodic functions.
Sine and Cosine Functions Sine and Cosine Functions We are going to deconstruct the Unit circle and graph the sine and cosine functions on graph Remember: Cosine is in the x spot in an ordered pair and Sine is in the y spot.
Vocabulary Vocabulary Sin wave - is a repetitive change or motion which, when plotted as a graph, has the same shape as the sine function. Amplitude - is the maximum distance it ever reaches from zero. Period - is the time it takes to perform one complete cycle. (2 for cosine and sin)
Sine Function To sketch the graph of y = sin x first locate the key points. These are the maximum points, the minimum points, and the intercepts. (5 total) y 3 3 1 2 2 2 2 2 x 1 3 0 x 2 2 2 sin x 0 0 1 0 -1
Sine Function f(x) = sin x The graph is continuous over its entire domain, ( , ). Its x-intercepts are of the form n , where n is an integer. Its period is 2 . The graph is symmetric with respect to the origin, so the function is an odd function. For all x in the domain, sin( x) = sin(x).
Amplitude The amplitude of y = a sin x (or y = a cos x) is half the distance between the maximum and minimum values of the function. amplitude = |a| If |a| > 1, the amplitude stretches the graph vertically. If 0 < |a| > 1, the amplitude shrinks the graph vertically. If a < 0, the graph is reflected in the x-axis. The graph of y = a sin x or y = a cos x, with a 0, will have the same shape as the graph of y = sin x or y = cos x, respectively, except the range will be [ |a|, |a|]. The amplitude is |a|.
Amplitude Example: Graph y = 3 sin x compare to y = sin x. Make a table of values. x /2 3 /2 0 1 sin x 0 1 0 0 3 3sin x 0 3 0 0 The range of y = 3sin x is [ 3, 3].
Amplitude y 4 y = sin x 3 2 2 2 x 1 y = sin x 2 y = 2 sin x y = 4 sin x reflection of y = 4 sin x y = 4 sin x 4
Period For b > 0, the graph of y = sin bx will resemble that of y = sin x, but with period Divide the interval into four equal parts to obtain the values for which sin bx equal 1, 0, or 1. (These values give the minimum points, x-intercepts, and maximum points on the graph)
GRAPHING GRAPHING y y = sin = sin bx bx Graph y = sin 2x and compare to the graph of y = sin x. The coefficient of x is 2, so b = 2, and the period is The endpoints are 0 and and the three points between the endpoints are The x-values are:
GRAPHING GRAPHING y y = sin = sin bx bx Graph y = sin 2x and compare to the graph of y = sin x. Y = sin2x X Y (x, y) 0 ? 4 ? 2 3? 4 ?
GRAPHING GRAPHING y y = sin = sin bx bx Graph y = sin 2x and compare to the graph of y = sin x.
Homework Homework Page 141 # 1-7 (odds) #10


 = sin x")