Comparing Bike Pedal Motion to Sine Function Graph
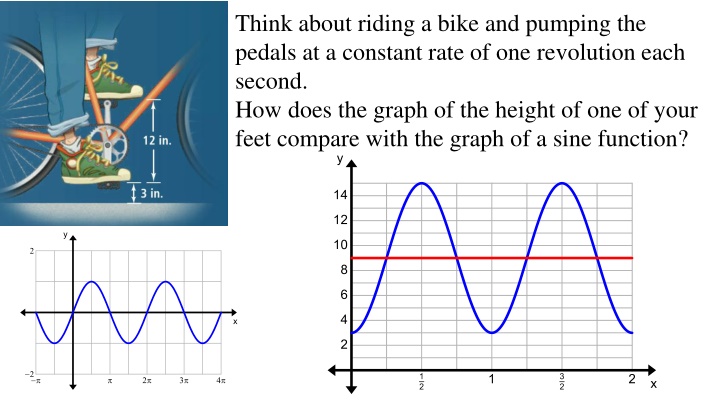
When riding a bike and pumping the pedals at a constant rate, the graph of the height of one foot follows a pattern similar to a sine function. Understanding the relationship between the two graphs can help in visualizing trigonometric functions and their translations.
Download Presentation

Please find below an Image/Link to download the presentation.
The content on the website is provided AS IS for your information and personal use only. It may not be sold, licensed, or shared on other websites without obtaining consent from the author.If you encounter any issues during the download, it is possible that the publisher has removed the file from their server.
You are allowed to download the files provided on this website for personal or commercial use, subject to the condition that they are used lawfully. All files are the property of their respective owners.
The content on the website is provided AS IS for your information and personal use only. It may not be sold, licensed, or shared on other websites without obtaining consent from the author.
E N D
Presentation Transcript
Think about riding a bike and pumping the pedals at a constant rate of one revolution each second. How does the graph of the height of one of your feet compare with the graph of a sine function?
13-7 Translating Trigonometric Functions Today s Objective: I can write and graph a trigonometric functions.
Translating Functions Vertical ?(?) Horizontal ?(?) Translate h units horizontally ? ? + ? ?(? ) Translate k units vertically Midline: y = k Phase Shift ? = ??? ? ? ? = ??? ? + ? ? h=? ? ? = ? ? = ???(?) ? = ???(?)
Family of Trigonometric Functions Parent Functions Transformed Function ? = ? sin?(? ?) + ? ? = ? cos?(? ?) + ? ? = sin? ? = cos? ? = Amplitude: Vertical stretch or shrink 2? ? =Phase shift: Horizontal shift = Period ? =Vertical shift : y = k is midline
Graph each function on interval from 0 to 2 ? = sin ? +? 2 Amplitude: Midline: 1 2 ? = 2 Period: 2? Left ? Phase Shift: 2 Graphing: 1. Sketch in Midline (y = k) 2. Graph beginning point with phase shift. 3. Graph remaining four points.
Graph each function on interval from 0 to 2 ? = 2cos ? ? 3 Amplitude: Midline: 2 + 1 ? = 1 Period: 2? Right ? Phase Shift: 3 Graphing: 1. Sketch in Midline (y = k) 2. Graph beginning point with phase shift. 3. Graph remaining four points.
Write a sine and cosine function for the graph. ? = ? sin?(? ?) + ? ? ? ? = sin (? ) + ? ? ? ? = ? cos?(? ?) + ? ?? ? ? = cos (? ? ) + ? ?
Graph each function on interval from 0 to 2 ? = 3sin2 ? ? 6 Amplitude: Midline: 3 + 2 ? = 2 Period: ? Right ? Phase Shift: 6 Graphing: 1. Sketch in Midline (y = k) 2. Graph beginning point with phase shift. 3. Graph remaining four points.
