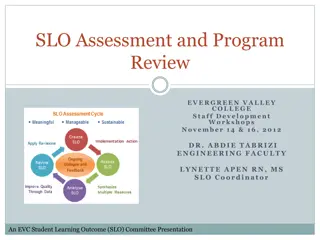
Simplified SLO Reporting Insights
This content provides insights into simplified SLO reporting, including a study on enrollment trends affecting future projections, challenges in reporting strategies, survey findings on quantitative and qualitative aspects, and more. It explores the evolution of reporting strategies and outcomes assessment for continuous improvement.
Download Presentation

Please find below an Image/Link to download the presentation.
The content on the website is provided AS IS for your information and personal use only. It may not be sold, licensed, or shared on other websites without obtaining consent from the author.If you encounter any issues during the download, it is possible that the publisher has removed the file from their server.
You are allowed to download the files provided on this website for personal or commercial use, subject to the condition that they are used lawfully. All files are the property of their respective owners.
The content on the website is provided AS IS for your information and personal use only. It may not be sold, licensed, or shared on other websites without obtaining consent from the author.
E N D
Presentation Transcript
The next step to simplified SLO reporting
Planning today Step 7 Step 7 if Step 8 if Step 9 if Step 10 if Step 11 if Step 12 if Step 13 if Step 1 Step 1a Step 1b Step 1c Step 1d Step 1e Step 1f Step 1g Id ASMT OREN COUN EDPL FUP S80 S90 S100 0 0 0 0 0 0 0 0 0 0 0 0 0 0 0 0 0 0 0 0 0 0 0 0 0 0 0 0 0 0 1 0 1 0 0 0 0 0 0 1 0 1 0 0 0 0 0 0 A working paper of Lawson, Zentner and Sanchez (2014) sought to quantify the relationship between past enrollments and how these relationships influence future enrollment projections. A longitudinal analysis of historic enrollment data from California K-12 schools was conducted to determine whether K-8 enrollments affect High School enrollments. Data collected from the California Department of Education was aggregated and manipulated to create a new historic enrollment trend measurement that accounted for how previous grades affect the enrollment patterns of future grades. One county s enrollments (Orange, CA) was selected as the test population. In each study, a Weighted Enrollment Segment Mean (WESM) was used to predict different years enrollment numbers. The study yielded 96.87% accuracy in predicting next-year enrollment numbers based off of an oscillating momentum factor derived from weighted enrollment segments for years 1987-2012.When only the predictions from 2000-2012 were accounted for, the accuracy of the model rose to 98.75% with a forecast error of 1.257%. Additionally, when only 2006-2012 projections were accounted for, the model's accuracy was 98.913% with a forecast error of 1.088%. The working paper is seeking to replicate the results across different counties through the advancement of a new modeling structure in 2015. a b c d e f g h i j k l m n o p 0 0 0 0 0 0 0 0 0 0 1 0 0 1 0 0 0 0 0 0 0 0 0 0 0 0 1 0 0 1 0 0 1 1 0 0 1 0 1 0 1 1 0 1 1 0 0 0 1 1 0 0 1 0 1 0 1 1 0 1 1 0 0 0 1 1 0 0 1 0 1 0 1 1 0 1 1 0 0 0 Step 6 Means nothing Call this LOL Text in the meeting Diaper Step 2 Drink Eat Sleep Play Poop Step 5 Eye Ice tea Bros Database Step 3 Apple Cat Car Beard Step 4 Guess Jump Butter
Outcomes Assessment Developing a culture of evidence Continuous improvement Moving the needle
Limitation in Reporting Strategies Facts: Everyone SLO Assessment Assumptions: 100% of SLOs are reported during the assessment cycle The interface is easy Limited training is needed and utilized There is a clear line from assessment to planning
Survey Findings: Quantitative Why not 100%? 11% Difficult user interface 39% Lack of training 50% Lack of information
Survey Findings: Qualitative Why not 100%? Relevency in the data 4% 25% 29% Limited support for part-time faculty Contractual issues 4% 38% Associated benefit Time to complete SLO assessment
Resistance Do I need to say more
Case Study Traditional Progression Identified Limitation Faculty Agreement Implementation
Case Study Findings 86% 100% SLO Cloud Electronic 31% 25% 2010-2011 2011-2012 2012-2013 2013-2014
Research Conclusions The work level stayed the same Agreements and continuous training drove the process 25% to 86% User-friendly systems created a shift in reporting to 100% participation Replication
SLO Cloud Progression Re-engineering the SLO Cloud focus on the foundational keys of: Access Usability Security Accuracy
Cloud bit.do/slocloud
Best Practices to Engage Participation Foster an environment of faculty and staff driven assessment Draw meaningful linkages to planning Incentivize the purpose of assessment Lead by example
SLO Cloud 3.0 Unitary level reporting Linkage to the database Federated identity (No more multi-logins) Feeds SLQ server for real-time dashboard querying
