Reactor Pressure Vessel Tracer Study Summary


Garberville Sanitary District
CA1210008
Tracer Study
February 4, 2019

•
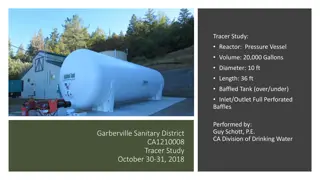
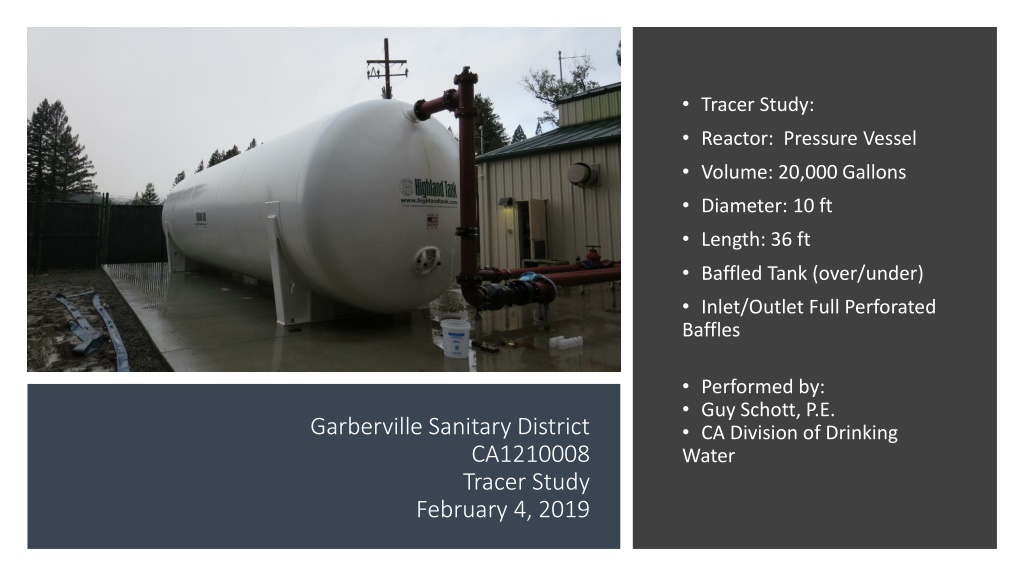
Tracer Study:
•
Reactor: Pressure Vessel
•
Volume: 20,000 Gallons
•
Diameter: 10 ft
•
Length: 36 ft
•
Baffled Tank (over/under)
•
Inlet/Outlet Full Perforated
Baffles
•
Performed by:
•
Guy Schott, P.E.
•
CA Division of Drinking
Water
Table of Content
Garberville SD
Tracer Test Results
•
Modified Step-Dose
•
Test Date: 2/4/19
•
Baffling Factor (t
10
/HRT): 0.54
•
Average Flow: 204 gpm
•
HRT: 98 minutes
•
t
10
: 53 minutes
•
Tracer: Fluoride (2.55 mg/L)
•
Inlet Sample Frequency:
•
5 gallon bucket (fill duration 4
-5 min)
•
12 samples (6 – 59 min range)
•
Outlet Sample Frequency:
•
0 – 40 min (4 min)
•
40 – 69 min (1 min)
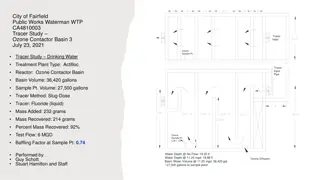
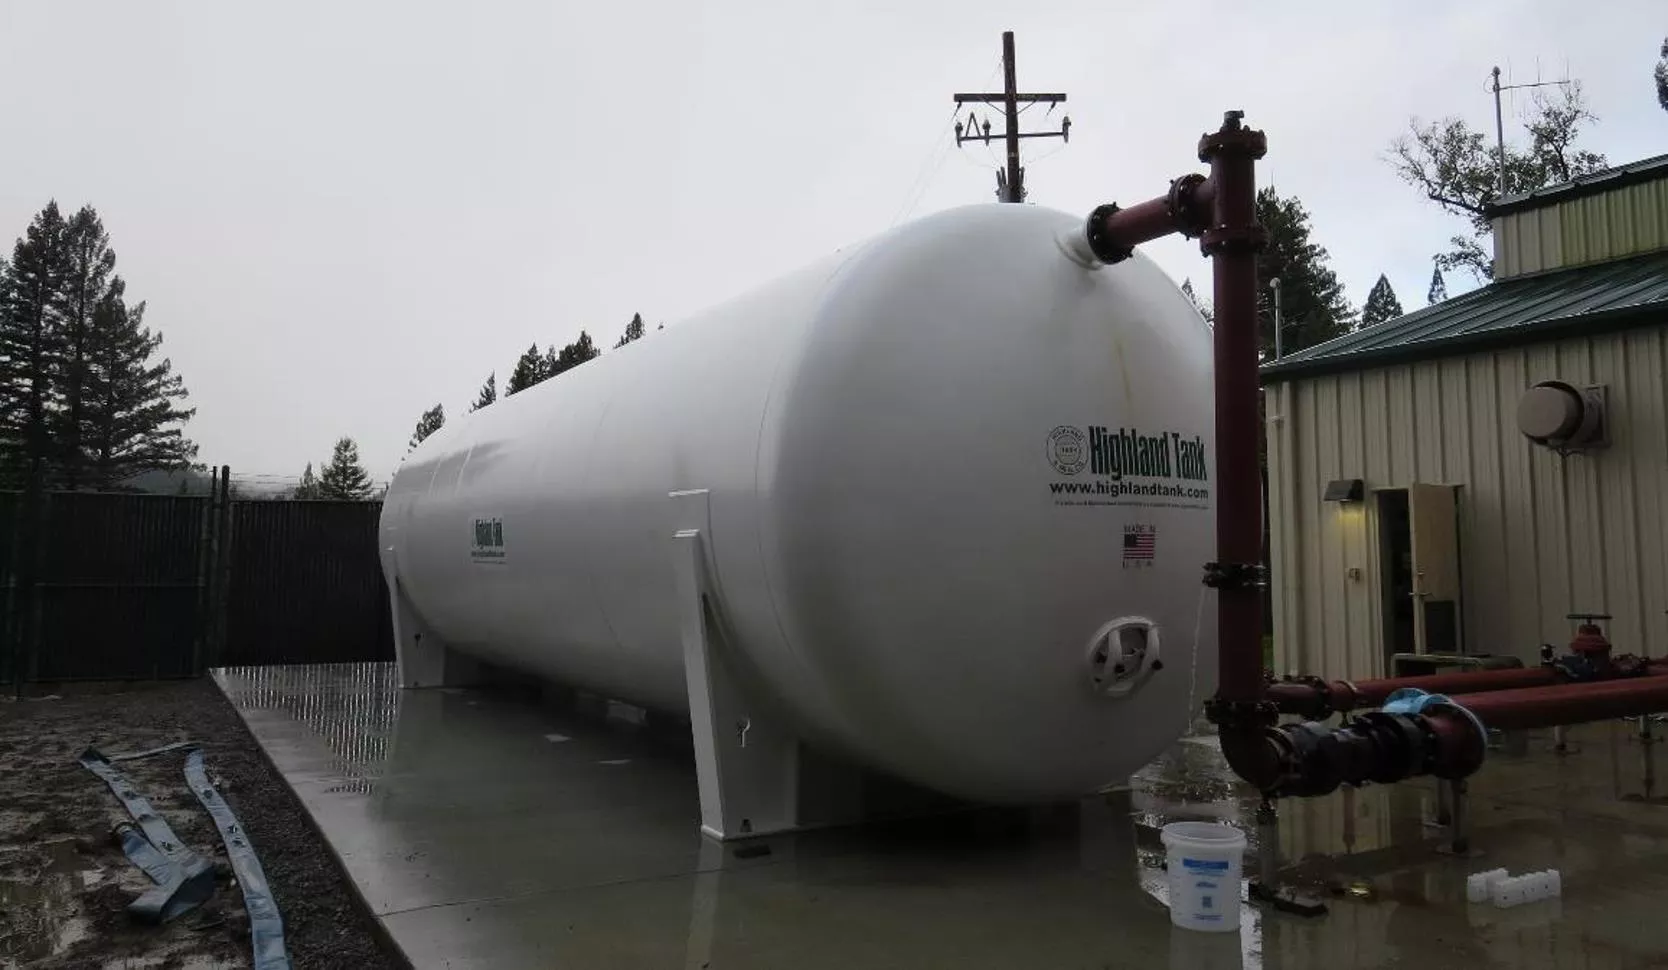
Horizontal Pressure Clearwell Design
The inlet baffled holes were plugged off except the 12 holes within the highlighted boundary.
Inlet Tracer Sample
Location
•
The applied tracer dosage is determined by grab
sampling downstream of the tracer injection
point before the tank inlet. Sample water is
allowed to flow into a 5 gallon bucket for 4-5
minutes then sample is taken from bucket. This
provides an average tracer dosage concentration.
Samples are taken throughout the tracer study.
Outlet Tracer Sample
Location
•
Samples are taken from the outlet to determine
the time it takes for 10% of the applied tracer
dosage to exit the tank. Sample frequency is
increased in the time range of the expected 10%
dosage mass.
•
Sample Frequency for this test:
0 – 40 minutes (4 minute intervals)
40 – 69 minutes ( 1 minute intervals)
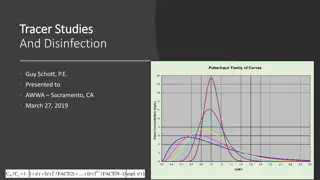
Garberville SD – Modified Step-Dose Curve
Dosage: 2.64 mg/L
0.26 mg/L at t
10
t
10
: 53 min
HRT: 98 min
t
10
/HRT = 0.54
Garberville SD – Modified Step-Dose Curve
Normalized to F-Curve
t
10
/HRT = 0.54
Purpose of a
Tracer Study
•
To determine the hydraulic efficiency or disinfectant
exposure time of water through one or more reactors.
•
The addition of known quantities of a nonreactive
chemical (tracer) is added in the form of a pulse (slug) or
step-input.
•
The time of travel or disinfectant exposure time through
the reactor is related to:
•
Flow rate
•
Reactor water volume
•
Water Depth
•
Reactor configuration
Disinfection
Exposure
Time of
Fluid in
Vessel for
Determining
Ct
10
C
t
1
0
V
a
l
u
e
- Log inactivation is based on the
Delivered Dose
, “
Ct
10
”
“
C
” is the disinfectant residual (mg/L)
“
t
10
” is the exposure or contact time (minutes)
Multiply them:
C
•
t
10
= mg/L
•
min
(delivered dose)
The calculated
Ct
10
value is looked up in
EPA
Ct
tables to
determine the log inactivation based on specific
monitoring parameters (pH, disinfectant residual and/or
temperature).
Baffling Factor
(BF)
•
Baffling factor or short-circuiting factor:
•
Determined from tracer study or estimated
•
BF
= t
10
/
HRT
from tracer study
•
HRT (hydraulic residence time) = reactor volume
divided by reactor flow
•
Once the BF is determined, then it is applied to the
operations of the reactor for determining the
disinfectant exposure time.
Example:
•
Clearwell operating volume: 20,000 gallons
•
Exit flow: 200 gpm
•
BF
: 0.50, from tracer study
•
Calculated contact or disinfection exposure time:
•
20,000 gal ÷ 200 gpm × 0.50 = 50
minutes
=
t
10
Test Method
Modified Step-Dose Method
•
It is a continue feed of tracer at constant rate and plant flow throughout the
duration of the test. The “Step-Dose” test is run to 3-4 HRT to achieve reactor
outlet steady-state tracer concentration. The time “t
10
” is determined when 10%
of the tracer dose concentration has exist the reactor. The “Modified Step-Dose”
test allows the test to be completed in less than 1 HRT by physical measurements
of the tracer inlet flow concentration to verify dosage.
Method of Analysis
and Equipment
•
Intellical™ ISEF121 Fluoride (F
-
) Ion Selective
Electrode (ISE)
•
HQ40d Portable ISE Multi-Parameter Meter
•
Fluoride Ionic Strength Adjustor (ISA)
•
Fluoride Standards (0.2/2.0 & 0.5/ 5.0 mg/L)
•
50 mL graduated cylinder
•
Finnpipette F2 variable volume pipette, capacity
0.5 - 5 mL
•
Electrode stirrer stand
•
50 mL beakers
•
Stir Bar, Magnetic, Polygon
Contact
•
Guy Schott, P.E.
•
State Water Resources Control Board
•
Division of Drinking Water
•
Santa Rosa, CA
•
Guy.Schott@waterboards.ca.gov
•
707-576-2732
This summary covers a tracer study conducted on a reactor pressure vessel with a volume of 20,000 gallons, detailing design parameters, tracer test results, sampling locations, and important data for disinfection exposure time determination. The study was performed by Guy Schott, P.E., offering insights into baffle design, tracer methods, and analysis approaches.

Download Presentation

Please find below an Image/Link to download the presentation.
The content on the website is provided AS IS for your information and personal use only. It may not be sold, licensed, or shared on other websites without obtaining consent from the author.If you encounter any issues during the download, it is possible that the publisher has removed the file from their server.
You are allowed to download the files provided on this website for personal or commercial use, subject to the condition that they are used lawfully. All files are the property of their respective owners.
The content on the website is provided AS IS for your information and personal use only. It may not be sold, licensed, or shared on other websites without obtaining consent from the author.
E N D
Presentation Transcript
Tracer Study: Reactor: Pressure Vessel Volume: 20,000 Gallons Diameter: 10 ft Length: 36 ft Baffled Tank (over/under) Inlet/Outlet Full Perforated Baffles Performed by: Guy Schott, P.E. CA Division of Drinking Water Garberville Sanitary District CA1210008 Tracer Study February 4, 2019
Summary of Tracer Results Reactor Design Tracer Sample Locations Graph 1: Modified Step-Dose Curve Graph 2: Normalized Modified Step-Dose Curve to F-Curve Purpose of a Tracer Test Disinfection Exposure Time of Fluid in Vessel for Determining Ct10 Ct10Value Baffling Factor (BF) Tracer Test Method Method of Analysis and Equipment Table of Content
Modified Step-Dose Test Date: 2/4/19 Baffling Factor (t10/HRT): 0.54 Average Flow: 204 gpm HRT: 98 minutes t10: 53 minutes Tracer: Fluoride (2.55 mg/L) Inlet Sample Frequency: 5 gallon bucket (fill duration 4 -5 min) 12 samples (6 59 min range) Outlet Sample Frequency: 0 40 min (4 min) 40 69 min (1 min) Garberville SD Tracer Test Results
Horizontal Pressure Clearwell Design 20,000 Gallon Tank Notch Baffled Top & Bottom Inlet Outlet 32 x 4-in round holes 5 x 3-in round holes (center); Inlet/outlet full baffles 10' diameter, 31' shell length, 36.3' total length 5'-1" from baffle to baffle Half baffles project 1" pass center line Tracer Sampling The inlet baffled holes were plugged off except the 12 holes within the highlighted boundary.
Inlet Tracer Sample Location The applied tracer dosage is determined by grab sampling downstream of the tracer injection point before the tank inlet. Sample water is allowed to flow into a 5 gallon bucket for 4-5 minutes then sample is taken from bucket. This provides an average tracer dosage concentration. Samples are taken throughout the tracer study.
Outlet Tracer Sample Location Samples are taken from the outlet to determine the time it takes for 10% of the applied tracer dosage to exit the tank. Sample frequency is increased in the time range of the expected 10% dosage mass. Sample Frequency for this test: 0 40 minutes (4 minute intervals) 40 69 minutes ( 1 minute intervals)
Garberville SD Modified Step-Dose Curve Step-Dose Curve 0.55 0.50 Dosage: 2.64 mg/L 0.26 mg/L at t10 t10: 53 min HRT: 98 min 0.45 0.40 TRACER CONCENTRATION 0.35 0.30 0.25 0.20 0.15 t10/HRT = 0.54 0.10 0.05 0.00 0 4 8 12 16 20 24 28 32 36 40 44 48 52 56 60 TIME (MINUTES)
Garberville SD Modified Step-Dose Curve Normalized to F-Curve Normalized F-Curve 0.20 0.18 0.16 0.14 TRACER NORMALIZED 0.12 0.10 0.08 0.06 t10/HRT = 0.54 0.04 0.02 0.00 0.00 0.05 0.10 0.15 0.20 0.25 0.30 0.35 0.40 0.45 0.50 0.55 0.60 0.65 t/HRT)
To determine the hydraulic efficiency or disinfectant exposure time of water through one or more reactors. The addition of known quantities of a nonreactive chemical (tracer) is added in the form of a pulse (slug) or step-input. The time of travel or disinfectant exposure time through the reactor is related to: Flow rate Reactor water volume Water Depth Reactor configuration Purpose of a Tracer Study
C is the disinfectant residual (mg/L) at the point of inactivation compliance. Disinfection Exposure Time of Fluid in Vessel for Determining Ct10 The disinfection exposure time of water used for Ct10 calculation is the time (t10) it takes for 10 percent of the water entering the reactor to exit the reactor. To determine this, a marker (nonreactive tracer) is introduced into the water and is monitored leaving the reactor. Example: 1.0 Kg of tracer is slug-dose; t10 is that time when 0.1 Kg of tracer material (10%) has exit the reactor.
- Log inactivation is based on the Delivered Dose, Ct10 C is the disinfectant residual (mg/L) t10 is the exposure or contact time (minutes) Multiply them: Ct Ct10 10 Value Value C t10= mg/L min (delivered dose) The calculated Ct10 value is looked up in EPA Cttables to determine the log inactivation based on specific monitoring parameters (pH, disinfectant residual and/or temperature).
Baffling factor or short-circuiting factor: Determined from tracer study or estimated BF = t10/ HRT from tracer study HRT (hydraulic residence time) = reactor volume divided by reactor flow Once the BF is determined, then it is applied to the operations of the reactor for determining the disinfectant exposure time. Baffling Factor (BF) Example: Clearwell operating volume: 20,000 gallons Exit flow: 200 gpm BF: 0.50, from tracer study Calculated contact or disinfection exposure time: 20,000 gal 200 gpm 0.50 = 50 minutes = t10
Test Method Modified Step-Dose Method It is a continue feed of tracer at constant rate and plant flow throughout the duration of the test. The Step-Dose test is run to 3-4 HRT to achieve reactor outlet steady-state tracer concentration. The time t10 is determined when 10% of the tracer dose concentration has exist the reactor. The Modified Step-Dose test allows the test to be completed in less than 1 HRT by physical measurements of the tracer inlet flow concentration to verify dosage.
Method of Analysis and Equipment Intellical ISEF121 Fluoride (F-) Ion Selective Electrode (ISE) HQ40d Portable ISE Multi-Parameter Meter Fluoride Ionic Strength Adjustor (ISA) Fluoride Standards (0.2/2.0 & 0.5/ 5.0 mg/L) 50 mL graduated cylinder Finnpipette F2 variable volume pipette, capacity 0.5 - 5 mL Electrode stirrer stand 50 mL beakers Stir Bar, Magnetic, Polygon
Contact Guy Schott, P.E. State Water Resources Control Board Division of Drinking Water Santa Rosa, CA Guy.Schott@waterboards.ca.gov 707-576-2732


 at the point of")