Quantitative Analysis of Enzyme Activity in Biochemistry
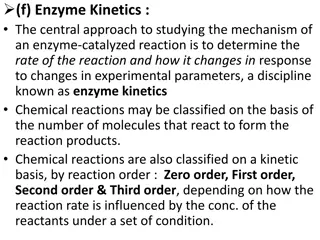
Dive into the fascinating world of enzyme kinetics with a focus on understanding and interpreting data through quantitative analysis. Explore the fundamentals of Michaelis-Menten kinetics, reaction rates, and experimental design to unravel the secrets of enzyme behavior in biological systems.

Download Presentation

Please find below an Image/Link to download the presentation.
The content on the website is provided AS IS for your information and personal use only. It may not be sold, licensed, or shared on other websites without obtaining consent from the author.If you encounter any issues during the download, it is possible that the publisher has removed the file from their server.
You are allowed to download the files provided on this website for personal or commercial use, subject to the condition that they are used lawfully. All files are the property of their respective owners.
The content on the website is provided AS IS for your information and personal use only. It may not be sold, licensed, or shared on other websites without obtaining consent from the author.
E N D
Presentation Transcript
Group 1 Interface of Chemistry and Biology Quantitative Analysis of Enzyme Activity Leon Dickson Howard University Steven Glynn Stony Brook University Lindsay Hinkle Harvard University Kevin Jones Howard University Scott Sutherland Stony Brook University Rosa Veguilla Harvard University
Goals and Objectives Learning Goal: Students will have the ability to manipulate, interpret, and produce visual representations of data describing kinetic properties of enzymes Learning Objectives: Students will be able to: Determine reaction rates from experimental time-course data Produce the Michaelis-Menten plot from experimental data Interpret changes in reaction conditions from different Michaelis- Menten plots Design an experiment to generate data for a Michaelis-Menten plot
Who you are: Upper level Biochemistry major who has completed Calculus and Introductory Chemistry and Biology We re halfway through a lecture in steady- state enzyme kinetics. See tip sheet for topics you have covered.
HIV-1 protease is crucial for the replication of HIV (necessary for HIV replication) Inhibiting the activity of HIV-I protease is a strategy for combating the virus The first step in designing an inhibitor is to understand the kinetic properties of the enzyme
Steady-state enzyme kinetics Assumptions of Michaelis-Menten kinetics: 1. The reaction is at equilibrium 2. The reaction is at steady-state
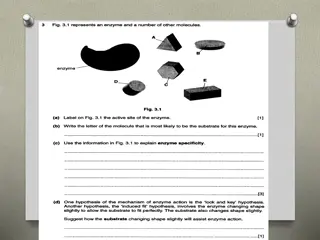
Choose the components of the HIV- 1 protease reaction Cleaved viral polypeptides HIV-1 protease/ Viral polypeptide complex HIV-1 protease Viral polypeptide
An enzymes response to substrate can be visualized using the Michaelis-Menten plot Initial reaction velocity ( M sec-1) Vmax Vmax/2 Substrate concentration ( M) KM Michaelis-Menten Equation
Activity 1 Match the experimental data to the corresponding line on the plot of time- course reactions Remember that the slope of the time-course corresponds to the rate of the reaction at a given substrate concentration
Clicker question Using your handout, identify which time-course corresponds to an initial [S] of 25 uM?
Activity 1I A. Use the reaction velocities from the time-course data to construct a Michaelis-Menten plot B. Use your plot to estimate Vmax and KM for your enzyme
Vmax Vo [S] KM
Clicker question What value for KM did you determine from your Michaelis- Menten plot? A. 0 5 M B. 8 12 M C. 40 50 M D. 80 100 M
Using enzyme kinetics to evaluate drug candidates -Group1avir + Group1avir Vmax = 96.4 M KM = 10.2 M Vmax = 96.4 M KM = 47.0 M Is Group1avir a possible drug candidate against HIV? (intracelluar substrate concentration is ~20 M)
Trends in Annual Age-Adjusted* Rate of Death Due to HIV Infection, United States, 1987 2009 Saquinavir released onto market by Roche Note: For comparison with data for 1999 and later years, data for 1987 1998 were modified to account for ICD-10 rules instead of ICD-9 rules. *Standard: age distribution of 2000 US population
In the next lab session you will: Measure rates of an enzyme- catalyzed reaction Use your data to construct a Michaelis-Menten plot Determine values for Vmax and KM
Lets remind ourselves what weve accomplished In this class you: Determined a reaction rate from experimental time-course data Produced the Michaelis-Menten plot from experimental data and estimate the kinetic parameters Used Michaelis-Menten plots to infer changes in enzyme activity, e.g. in the context of a human disease