Protein Secondary Structure Prediction: Insights and Methods

undefined
 
Protein Secondary Structure
Prediction
 
Some of the slides are adapted from Dr. Dong Xu’s lecture notes
 
Why secondary structure
prediction?
 
Accurate secondary structure prediction can be
an important information for the tertiary
structure prediction
Protein function prediction
Protein classification
Predicting structural change
An easier problem than 3D structure prediction
(more than 40 years of history).
 
 helix
 
α-helix (30-35%)
Hydrogen bond between C=O (carbonyl) & NH (amine)
groups within strand (4 positions apart)
3.6 residues / turn, 1.5 Å rise / residue
Typically right hand turn
Most abundant secondary structure
α-helix formers: A,R,L,M,E,Q,K


s
h
e
e
t
 
&
 
 
t
u
r
n
 
β-sheet / β-strand (20-25%)
Hydrogen bond between groups across strands
Forms parallel and antiparallel pleated sheets
Amino acids less compact – 3.5 Å between adjacent residues
Residues alternate above and
 
below β-sheet
β-sheet formers: V,I,P,T,W
β-turn
Short turn (4 residues)
Hydrogen bond between C=O &
 
NH groups within strand
 
(3 positions apart)
Usually polar, found near surface
β-turn formers: S,D,N,P,R
 
 
-
s
h
e
e
t
(
p
a
r
a
l
l
e
l
,
 
a
n
t
i
-
p
a
r
a
l
l
e
l
)
 
Others
 
Loop (bridging region)
Regions between α-helices and β-sheets
On the surface, vary in length and 3D configurations
Do not have regular periodic structures
Loop formers: small polar residues
 
Coil (40-50%)
Generally speaking, anything besides α-helix, β-sheet,
β-turn
 
Proteins – Structural Classes
 
Proteins can be classified by dominant structures
SCOP (Structural Classification Of Proteins)
Class α  α-helices connected by loops
Class β  antiparallel sheets
Class α / β  parallel β-sheets with intervening α-helices
Class α + β  segregated α-helices and antiparallel β-sheets
Multidomain combinations of classes
Membrane membranes & cell surface proteins
Small proteins metal ligand, heme, and/or disulfide bridges
Coiled coil 2-3 α-helices coiled around each other
Low resolution
Peptides not true classes
Designed
 
Proteins – Structural Classes
 
Assigning Secondary Structure
 
Defining features
Defining features
Dihedral angles
Dihedral angles
Hydrogen bonds
Hydrogen bonds
Geometry
Geometry
Assigned manually by crystallographers or
Automatic
Automatic
DSSP
DSSP
 (Definition of secondary structure of proteins, Kabsch
 (Definition of secondary structure of proteins, Kabsch
& Sander,1983)
& Sander,1983)
STRIDE
STRIDE
 (Frishman & Argos, 1995)
 (Frishman & Argos, 1995)
Continuum
Continuum
 (Claus Andersen, Burkhard Rost, 2001)
 (Claus Andersen, Burkhard Rost, 2001)
 
Definition of secondary structure of
proteins (DSSP)
 
The DSSP code
H = alpha helix
B = residue in isolated beta-bridge
E = extended strand, participates in beta ladder
G = 3-helix (3/10 helix)
I = 5 helix (pi helix)
T = hydrogen bonded turn
S = bend
 
CASP Standard
H = (H, G, I), E = (E, B), C = (T, S)
 
Secondary Structure Prediction
 
Given a protein sequence (primary structure)
 
 
G
HWIAT
HWIAT
R
GQLIREAYEDY
GQLIREAYEDY
RHF
SS
SS
ECPFIP
 
Predict its secondary structure content
(C=Coils  H=Alpha Helix  E=Beta Strands)
 
G
HWIAT
HWIAT
R
GQLIREAYEDY
GQLIREAYEDY
RHF
SS
SS
ECPFIP
C
EEEEE
EEEEE
C
HHHHHHHHHHH
HHHHHHHHHHH
CCC
HH
HH
CCCCCC
 
Prediction Methods
 
Single sequence
Examine single protein sequence
Base prediction on
Statistics – composition of amino acids
Neural networks – patterns of amino acids
Multiple sequence alignment
First create MSA
Use sequences from PSI-BLAST, CLUSTALW, etc…
Align sequence with related proteins in family
Predict secondary structure based on consensus/profile
Generally improves prediction 8-9%
Accuracy
 
Correctly predicted residues
/
/
total residues
total residues
 
Statistical method (single sequence)
1974
1974
 Chou & Fasman
 Chou & Fasman
  
  
~50-53%
~50-53%
1978
1978
 Garnier
 Garnier
   
   
63%
63%
Statistical method (Multiple sequences)
1987
1987
 Zvelebil
 Zvelebil
   
   
66%
66%
1993
1993
 Yi & Lander
 Yi & Lander
  
  
68%
68%
Neural network
Neural network
1988
1988
 Qian & Sejnowski
 Qian & Sejnowski
  
  
64.3%
64.3%
1993
1993
 Rost & Sander
 Rost & Sander
  
  
70.8-72.0%
70.8-72.0%
1997
1997
 Frishman & Argos
 Frishman & Argos
  
  
<75%
<75%
1999
1999
 Cuff & Barton
 Cuff & Barton
  
  
72.9%
72.9%
1999
1999
 Jones
 Jones
    
    
76.5%
76.5%
2000
2000
 Petersen et al.
 Petersen et al.
  
  
77.9%
77.9%
 
Assumptions
 
The entire information for forming secondary
structure is contained in the primary sequence.
 
Side groups of residues will determine structure.
 
Examining windows of certain number of residues
is sufficient to predict structure.
 
Basis for window size selection:
a-helices 5 – 40 residues long
b-strands 5 – 10 residues long
 
 
Algorithm
 
Chou-Fasman Method
Chou-Fasman Method
 
Examining windows of 5 - 6 residues to predict
structure
structure
 
Secondary structure propensity
 
From PDB database, calculate the 
propensity
propensity
 for a given
 for a given
amino acid to adopt a certain ss-type
 
l
Example:
#Ala=2,000, #residues=20,000, #helix=4,000, #Ala in helix=500
P=?
ss
Index of aa
 
 
http://intro.bio.umb.edu/111-112/111F98Lect/folding.html
 
http://www.cs.ucl.ac.uk/staff/D.Jones/t42morph.html
 
http://www.youtube.com/watch?v=GzATbET
3g54&mode=related&search=
 
CS Day
 
http://www.cs.uakron.edu/~csday/
 
Complete and e-mail to 
csday@cs.uakron.edu
csday@cs.uakron.edu
 by
 by
Friday April 13
Friday April 13
 
Secondary structure propensity
 
From PDB database, calculate the 
propensity
propensity
 for a
 for a
given amino acid to adopt a certain ss-type
 
l
Example:
#Ala=2,000, #residues=20,000, #helix=4,000, #Ala in helix=500
P(
,aa
i
) = 500/20,000, p(

p(aa
i
) = 2,000/20,000
= 500 / (4,000/10) = 1.25
 
 
Chou-Fasman parameters
 
Note: The parameters given in the textbook are 
100*P
i
 
Chou-Fasman
Chou-Fasman
 algorithm
 algorithm
 
Helix:
Scan through the peptide and identify regions where 4 out of
6 contiguous residues have P(H) > 1.00. That region is
declared an alpha-helix.
Extend the helix in both directions until a set of four
contiguous residues that have an average P(H) < 1.00 is
reached. That is declared the end of the helix.
If the segment defined by this procedure is longer than 5
residues and the average P(H) > P(E) for that segment, the
segment can be assigned as a helix.
Repeat this procedure to locate all of the helical regions in the
sequence.
Initiation
 
Identify regions where 4/6 have a P(H) >1.00
“alpha-helix nucleus”
Propagation
 
Extend helix in both directions until a set of 
four
residues have an average P(H) <1.00.
 
If the average P(H) > P(E) for that segment,
the segment can be assigned as a helix.
 
Chou-Fasman
Chou-Fasman
 algorithm
 algorithm
 
B-strand:
Scan through the peptide and identify a region where 3 out of 5
of the residues have a value of P(E)>1.00. That region is
declared as a beta-sheet.
Extend the sheet in both directions until a set of four
contiguous residues that have an average P(E) < 1.00 is
reached. That is declared the end of the beta-sheet.
Any segment of the region located by this procedure is assigned
as a beta-sheet if the average P(E)>1.05 and the average
P(E)>P(H) for that region.
Any region containing overlapping alpha-helical and beta-sheet
assignments are taken to be helical if the average P(H) > P(E)
for that region. It is a beta sheet if the average P(E) > P(H) for
that region.
 
Chou-Fasman
Chou-Fasman
 algorithm
 algorithm
 
Beta-turn
To identify a bend at residue number j, calculate the
following value
   
p(t) = f(j)f(j+1)f(j+2)f(j+3)
If
(1)  p(t) > 0.000075,
(2)  the average value for P(turn) > 1.00 in the tetrapeptide and
(3)  the averages for the tetrapeptide obey the inequality
  
P(H) < P(turn) > P(E),
 
then a beta-turn is predicted at that location.
 
Exercise
 
Predict the secondary structure of the following
protein sequence:
 
 
Ala Pro Ala Phe Ser Val Ser Leu Ala Ser Gly Ala
 
142 57  142 113 77  106 77  121 142 77  57  142
 
83  55  83  138 75  170 75  130 83  75  75  83
 
66  152 66  60  143 50  143 59  66  143 156 66
 
Enter sequences
 
Compare Prediction to Reality
 
Adjust Weights
 
Neural network training
 
Neural net for secondary structure
 
Neural net for SS Prediction
 
Jury decisions
Use multiple neural networks & combine results
Average output
Majority decision
 
Neural net for SS Prediction
 
JPRED [Cuff+ 1998]
Finds consensus from PHD, PREDATOR, DSC, NNSSP,
etc…
Slide Note
Embed
Share

Accurate prediction of protein secondary structure is crucial for understanding tertiary structure, predicting protein function, and classification. This prediction involves identifying key elements like alpha helices, beta sheets, turns, and loops. Various methods such as manual assignment by crystallographers and automated tools like DSSP, STRIDE, and Continuum are employed for assigning secondary structure. Understanding the secondary structure provides valuable information for predicting protein structure changes and has been an active field of research for over 40 years.

  • Protein Secondary Structure
  • Prediction Methods
  • Alpha Helix
  • Beta Sheet
  • Protein Function

Uploaded on Oct 01, 2024 | 1 Views


Download Presentation

Please find below an Image/Link to download the presentation.

The content on the website is provided AS IS for your information and personal use only. It may not be sold, licensed, or shared on other websites without obtaining consent from the author. Download presentation by click this link. If you encounter any issues during the download, it is possible that the publisher has removed the file from their server.

E N D

Presentation Transcript


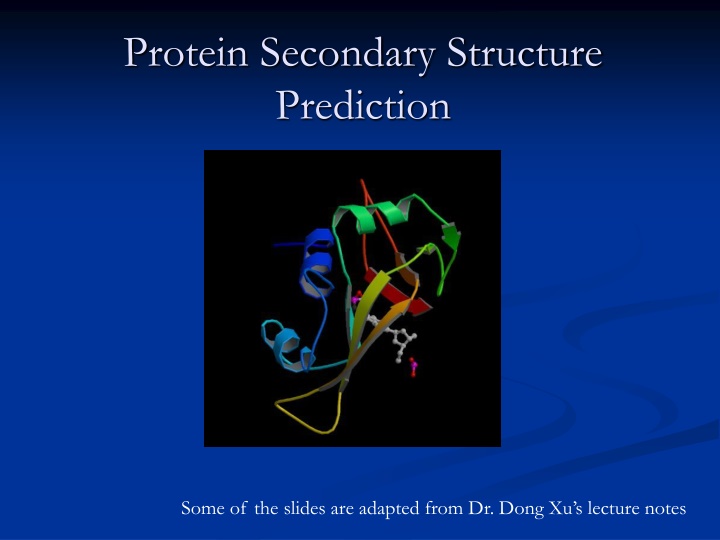
  1. Protein Secondary Structure Prediction Some of the slides are adapted from Dr. Dong Xu s lecture notes

  2. Why secondary structure prediction? Accurate secondary structure prediction can be an important information for the tertiary structure prediction Protein function prediction Protein classification Predicting structural change An easier problem than 3D structure prediction (more than 40 years of history).

  3. helix -helix (30-35%) Hydrogen bond between C=O (carbonyl) & NH (amine) groups within strand (4 positions apart) 3.6 residues / turn, 1.5 rise / residue Typically right hand turn Most abundant secondary structure -helix formers: A,R,L,M,E,Q,K

  4. sheet & turn -sheet / -strand (20-25%) Hydrogen bond between groups across strands Forms parallel and antiparallel pleated sheets Amino acids less compact 3.5 between adjacent residues Residues alternate above and below -sheet -sheet formers: V,I,P,T,W -turn Short turn (4 residues) Hydrogen bond between C=O & NH groups within strand (3 positions apart) Usually polar, found near surface -turn formers: S,D,N,P,R

  5. -sheet (parallel, anti-parallel)

  6. Others Loop (bridging region) Regions between -helices and -sheets On the surface, vary in length and 3D configurations Do not have regular periodic structures Loop formers: small polar residues Coil (40-50%) Generally speaking, anything besides -helix, -sheet, -turn

  7. Assigning Secondary Structure Defining features Dihedral angles Hydrogen bonds Geometry Assigned manually by crystallographers or Automatic DSSP (Definition of secondary structure of proteins, Kabsch & Sander,1983) STRIDE (Frishman & Argos, 1995) Continuum (Claus Andersen, Burkhard Rost, 2001)

  8. Definition of secondary structure of proteins (DSSP) The DSSP code H = alpha helix B = residue in isolated beta-bridge E = extended strand, participates in beta ladder G = 3-helix (3/10 helix) I = 5 helix (pi helix) T = hydrogen bonded turn S = bend CASP Standard H = (H, G, I), E = (E, B), C = (T, S)

  9. Secondary Structure Prediction Given a protein sequence (primary structure) GHWIATRGQLIREAYEDYRHFSSECPFIP Predict its secondary structure content (C=Coils H=Alpha Helix E=Beta Strands) GHWIATRGQLIREAYEDYRHFSSECPFIP CEEEEECHHHHHHHHHHHCCCHHCCCCCC

  10. Prediction Methods Single sequence Examine single protein sequence Base prediction on Statistics composition of amino acids Neural networks patterns of amino acids Multiple sequence alignment First create MSA Use sequences from PSI-BLAST, CLUSTALW, etc Align sequence with related proteins in family Predict secondary structure based on consensus/profile Generally improves prediction 8-9%

  11. Accuracy Correctly predicted residues/total residues Statistical method (single sequence) 1974 Chou & Fasman 1978 Garnier Statistical method (Multiple sequences) 1987 Zvelebil 1993 Yi & Lander Neural network 1988 Qian & Sejnowski 1993 Rost & Sander 1997 Frishman & Argos 1999 Cuff & Barton 1999 Jones 2000 Petersen et al. ~50-53% 63% 68% 66% 64.3% 70.8-72.0% <75% 72.9% 76.5% 77.9%

  12. Assumptions The entire information for forming secondary structure is contained in the primary sequence. Side groups of residues will determine structure. Examining windows of certain number of residues is sufficient to predict structure. Basis for window size selection: a-helices 5 40 residues long b-strands 5 10 residues long

  13. Algorithm Chou-Fasman Method Examining windows of 5 - 6 residues to predict structure

  14. Secondary structure propensity From PDB database, calculate the propensity for a given amino acid to adopt a certain ss-type Index of aa ss Example: #Ala=2,000, #residues=20,000, #helix=4,000, #Ala in helix=500 P=?

  15. http://intro.bio.umb.edu/111-112/111F98Lect/folding.html http://www.cs.ucl.ac.uk/staff/D.Jones/t42morph.html http://www.youtube.com/watch?v=GzATbET 3g54&mode=related&search=

  16. CS Day http://www.cs.uakron.edu/~csday/ Complete and e-mail to csday@cs.uakron.edu by Friday April 13

  17. Secondary structure propensity From PDB database, calculate the propensity for a given amino acid to adopt a certain ss-type Example: #Ala=2,000, #residues=20,000, #helix=4,000, #Ala in helix=500 P( ,aai) = 500/20,000, p( ) = p(aai) = 2,000/20,000 = 500 / (4,000/10) = 1.25

  18. Chou-Fasman parameters Note: The parameters given in the textbook are 100*P i

  19. Chou-Fasman algorithm Helix: Scan through the peptide and identify regions where 4 out of 6 contiguous residues have P(H) > 1.00. That region is declared an alpha-helix. Extend the helix in both directions until a set of four contiguous residues that have an average P(H) < 1.00 is reached. That is declared the end of the helix. If the segment defined by this procedure is longer than 5 residues and the average P(H) > P(E) for that segment, the segment can be assigned as a helix. Repeat this procedure to locate all of the helical regions in the sequence.

  20. Initiation Identify regions where 4/6 have a P(H) >1.00 alpha-helix nucleus T 69 S 77 P 57 T 69 A 142 E 151 L 121 M 145 R 98 S 77 T 69 G 57 P(H) T 69 S 77 P 57 T 69 A 142 E 151 L 121 M 145 R 98 S 77 T 69 G 57 P(H)

  21. Propagation Extend helix in both directions until a set of four residues have an average P(H) <1.00. T 69 S 77 P 57 T 69 A 142 E 151 L 121 M 145 R 98 S 77 T 69 G 57 P(H) If the average P(H) > P(E) for that segment, the segment can be assigned as a helix.

  22. Chou-Fasman algorithm B-strand: Scan through the peptide and identify a region where 3 out of 5 of the residues have a value of P(E)>1.00. That region is declared as a beta-sheet. Extend the sheet in both directions until a set of four contiguous residues that have an average P(E) < 1.00 is reached. That is declared the end of the beta-sheet. Any segment of the region located by this procedure is assigned as a beta-sheet if the average P(E)>1.05 and the average P(E)>P(H) for that region. Any region containing overlapping alpha-helical and beta-sheet assignments are taken to be helical if the average P(H) > P(E) for that region. It is a beta sheet if the average P(E) > P(H) for that region.

  23. Chou-Fasman algorithm Beta-turn To identify a bend at residue number j, calculate the following value p(t) = f(j)f(j+1)f(j+2)f(j+3) If (1) p(t) > 0.000075, (2) the average value for P(turn) > 1.00 in the tetrapeptide and (3) the averages for the tetrapeptide obey the inequality P(H) < P(turn) > P(E), then a beta-turn is predicted at that location.

  24. Exercise Predict the secondary structure of the following protein sequence: Ala Pro Ala Phe Ser Val Ser Leu Ala Ser Gly Ala 142 57 142 113 77 106 77 121 142 77 57 142 83 55 83 138 75 170 75 130 83 75 75 83 66 152 66 60 143 50 143 59 66 143 156 66

  25. Neural network training Compare Prediction to Reality Adjust Weights Enter sequences

  26. Neural net for secondary structure D (L) R (E) Q (E) A C D E F G H I K L M N P Q R S T V W Y . G (E) F (E) H V (E) E P (E) A (H) L A (H) Y (H) V (E) K (E) K (E)

  27. Neural net for SS Prediction Jury decisions Use multiple neural networks & combine results Average output Majority decision

  28. Neural net for SS Prediction JPRED [Cuff+ 1998] Finds consensus from PHD, PREDATOR, DSC, NNSSP, etc

Related


More Related Content

giItT1WQy@!-/#giItT1WQy@!-/#giItT1WQy@!-/#giItT1WQy@!-/#giItT1WQy@!-/#giItT1WQy@!-/#giItT1WQy@!-/#giItT1WQy@!-/#giItT1WQy@!-/#giItT1WQy@!-/#giItT1WQy@!-/#giItT1WQy@!-/#