Proposal for New Data Coding Format in Time Series - S-100 Change
A new data coding format is proposed for fixed station time series organization. The proposal includes extensions and clarifications to Part 10c in S-100 for supporting time series data. The comparison between data coding formats 1 and 8 highlights differences in handling real-time data, time intervals, and graphical products. The S-100 Change Proposal mainly focuses on introducing wording for the new data coding format=8, along with a new table for values group attributes to support non-uniform time intervals.
Download Presentation

Please find below an Image/Link to download the presentation.
The content on the website is provided AS IS for your information and personal use only. It may not be sold, licensed, or shared on other websites without obtaining consent from the author.If you encounter any issues during the download, it is possible that the publisher has removed the file from their server.
You are allowed to download the files provided on this website for personal or commercial use, subject to the condition that they are used lawfully. All files are the property of their respective owners.
The content on the website is provided AS IS for your information and personal use only. It may not be sold, licensed, or shared on other websites without obtaining consent from the author.
E N D
Presentation Transcript
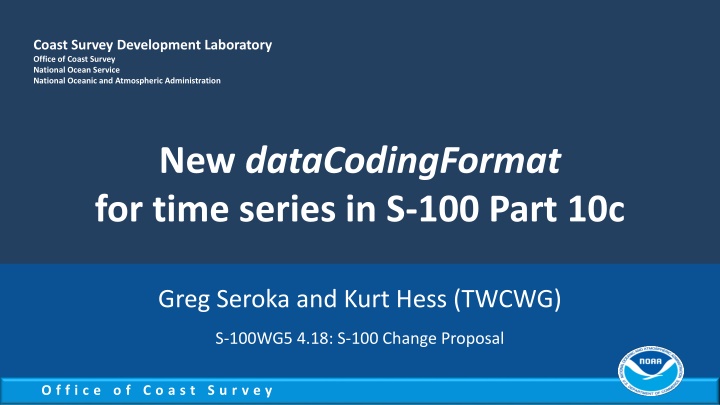
Coast Survey Development Laboratory Office of Coast Survey National Ocean Service National Oceanic and Atmospheric Administration New dataCodingFormat for time series in S-100 Part 10c Greg Seroka and Kurt Hess (TWCWG) S-100WG5 4.18: S-100 Change Proposal O f f i c e o f C o a s t S u r v e y
Summary 4.18A: S-100 Proposal - Extension to Part 10c New dataCodingFormat to support time series 4.18B: S-100 Proposal - Clarifications to Part 10c General editorial corrections 4.18C: Part 10c redline for both Remaining slides cover 4.18A
New dataCodingFormat A new dataCodingFormat for fixed station time series is proposed, organized by station rather than time: dataCodingFormat=1 Fixed station time series New dataCodingFormat=8 Fixed station (stationwise) time series Group_001=Data at Time No. 1 values across all stations Group_001=Data at Station No. 1 values across all times Group_002=Data at Time No. 2 values across all stations Group_002=Data at Station No. 2 values across all times etc. etc. Motivated by S-104 use case of graphic plot of multiple time series all times at one station
dataCodingFormat comparison dataCodingFormat = 1: supports animation of real-time data (display all station values at one time, then animate through time) but can t easily handle different start/end times, different time intervals can t easily handle non-uniform time intervals (and S-100 doesn t say how to handle these) is inefficient in storing one values group per time, especially for longer time series e.g. 1 yr of 6-min predicted water level data = 87,600 values groups dataCodingFormat = 8: handles well different start/end times, intervals, non-uniform intervals better supports longer time series better supports graphical products (e.g. graphic plot)
S-100 Change Proposal Change proposal form mainly includes adding wording for new dataCodingFormat=8 A few changes involve introducing a new table for values group attributes, including support for non-uniform time intervals: Table 10c-19 Attributes of values groups No Name Camel Case dataCodingFormat = 1, 2, 3, 5, 6 or 7 1 Time stamp timePoint dataCodingFormat = 8 1 2 3 4 5 6 7 Name of the station Station identification number Number of time records Index for time interval Time interval Valid time of earliest value Valid time of latest value (additional attributes) stationName stationNumber numberOfTimes timeIntervalIndex timeRecordInterval startDateTime endDateTime (as specified in Product Specification) for non-uniform intervals
S-100 Change Proposal The S-100 WG is invited to: Discuss the changes If agreed upon, endorse the extension (4.18A) and clarifications (4.18B) to Part 10c Take other actions as appropriate
dataCodingFormat=1 use case dataCodingFormat = 1 structured to support animation of real-time data (display all point values at one time and then animate through time) all stations at one or a few times: dataCodingFormat=1 Fixed station time series Group_001=Data at Time No. 1 values across all stations Group_002=Data at Time No. 2 values across all stations etc.
S-104 Use Cases for Time Series After selection of station: Use Case 1: Pick report Use Case 2: Graphic plot of multiple time series Pick report Time series may have different start/end times, # records Series have different types: prediction, etc. Series may have variable time intervals S-100 Ed. 4.0.0 Part 10c-6 mentions as a goal that the S-100 HDF5 profile must apply to either static data or time series data (for any of the other kinds), with fixed or variable intervals. S-100 does not say how to support this type of data Graphic plot
Sample S-104 File: dataCodingFormat=8 S-104 HDF5 File Feature Container: WaterLevel Feature Instance: WaterLevel.01 (predictions only) Values: Group_001=Data for Station No. 1 Values: Group_002=Data for Station No. 2 Feature Instance: WaterLevel.02 (observations only) Values: Group_001=Data for Station No. 2 Feature Instance: WaterLevel.03 (forecasts only) Values: Group_001=Data for Station No. 2
