Plant Bioinformatics Studies on ChIP-Seq Data Analysis
Plant bioinformatics researchers conducted experimental analyses and mapped gene regulatory networks using ChIP-Seq data. The studies involved exploring gene expression, regulatory interactions, and transcription factor binding sites. Techniques such as peak calling, motif finding, and peak annotation were employed to understand the regulatory mechanisms underlying plant gene expression.
Download Presentation

Please find below an Image/Link to download the presentation.
The content on the website is provided AS IS for your information and personal use only. It may not be sold, licensed, or shared on other websites without obtaining consent from the author.If you encounter any issues during the download, it is possible that the publisher has removed the file from their server.
You are allowed to download the files provided on this website for personal or commercial use, subject to the condition that they are used lawfully. All files are the property of their respective owners.
The content on the website is provided AS IS for your information and personal use only. It may not be sold, licensed, or shared on other websites without obtaining consent from the author.
E N D
Presentation Transcript
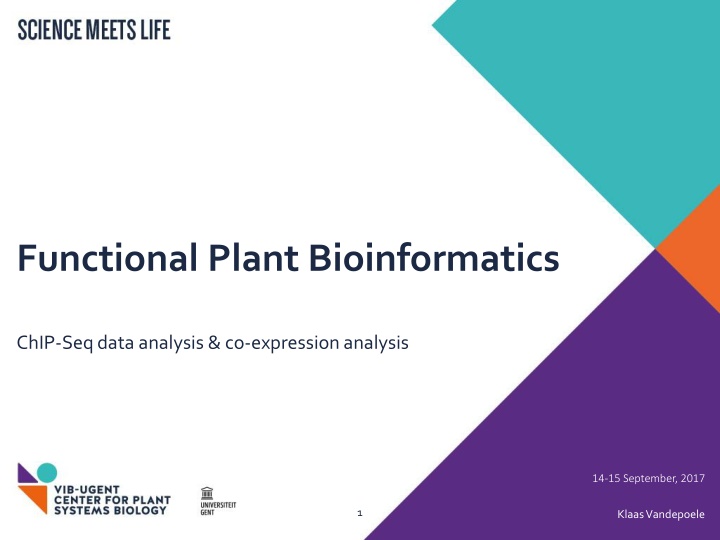
Functional Plant Bioinformatics ChIP-Seq data analysis & co-expression analysis 14-15 September, 2017 1 Klaas Vandepoele
Experimental analysis of gene expression & regulatory interactions ENCODE; Sullivan et al., 2015
Mapping of Gene Regulatory Networks (GRNs) Mejia-Guerra et al., 2012
Experimental characterization of regulatory interactions between Transcription Factors (TFs) and target genes SELEX PBM ChIP-Seq EMSA Y1H Mejia-Guerra et al., 2012
ChIP-Seq: measuring TF protein-DNA interactions ChIP in vivo method to measure protein-DNA interactions using chromatin immuno- precipitation Different cellular conditions can be profiled Requires TF-specific antibody* * Tagged TF protein can also be used TF ChIP-Seq Furey et al., 2012
TF ChIP-Seq processing Reliable peak calling Modelling TF binding site Farnham, 2009
Output ChIP-Seq peak calling procedure displayed in genome browser Gene annotation Reads sample Position Weight Matrix (PWM) Control Peak / Motif Read pileup
Detection binding site profiled TF de novo motif finding RSAT PeakMotifs Identifies overrepresented motifs in peak sequences motif composition (PWM) - 6 localization relative to peak center compares discovered motifs with reference motifs E2Fmotif mapping (WTTSSCSS / TTTSSCGC) E2F motif peaks TChAP 2598 730 (28,1) peaks peaks with E2F motif (%) Random occurrence E2F motif genes = 4,34% 8
ChIP-Seq peak annotation Peak ID 2_9908074_9908075 3_731683_731684 1_1277091_1277092 1_7906965_7906966 3_8780301_8780302 3_9058588_9058589 2_9810602_9810603 4_1415434_1415435 5_24493180_24493181 4_14542823_14542824 3_7655117_7655118 5_19245653_19245654 5_24384333_24384334 3_8460077_8460078 3_300242_300243 5_22968269_22968270 1_28000027_28000028 2_14374603_14374604 1_6883394_6883395 1_26663148_26663149 1_24532360_24532361 5_19115613_19115614 2_12683229_12683230 5_19839705_19839706 4_17136020_17136021 2_17563036_17563037 3_21097543_21097544 2_11096407_11096408 5_2936871_2936872 Chr 2 3 1 1 3 3 2 4 5 4 3 5 5 3 3 5 1 2 1 1 1 5 2 5 4 2 3 2 5 Start 9908075 731684 1277092 7906966 8780302 9058589 9810603 1415435 24493181 14542824 7655118 19245654 24384334 8460078 300243 22968270 28000028 14374604 6883395 26663149 24532361 19115614 12683230 19839706 17136021 17563037 21097544 11096408 2936872 End 9908075 731684 1277092 7906966 8780302 9058589 9810603 1415435 24493181 14542824 7655118 19245654 24384334 8460078 300243 22968270 28000028 14374604 6883395 26663149 24532361 19115614 12683230 19839706 17136021 17563037 21097544 11096408 2936872 Peak Score Annotation Distance to TSS Nearest PromoterID Gene.Name 11.52 Intergenic -2155 10.86 promoter-TSS (AT3G03170.1) -207 10.21 Intergenic -2296 8.43 promoter-TSS (AT1G22400.1) -293 7.94 promoter-TSS (AT3G24240.1) -122 7.94 TTS (AT3G24800.1) -2307 7.72 promoter-TSS (AT2G23050.1) -54 7.57 promoter-TSS (AT4G03210.1) -514 7.57 Intergenic -1510 7.49 promoter-TSS (AT4G29690.1) -343 7.37 intron (AT3G21720.1, intron 2 of 4) 893 7.21 promoter-TSS (AT5G47440.1) -304 7.21 Intergenic -1811 7.01 promoter-TSS (AT3G23580.1) 33 7.01 TTS (AT3G01830.2) -1595 6.84 5' UTR (AT5G56790.1, exon 1 of 9) 331 6.84 Intergenic -1207 6.84 promoter-TSS (AT2G34020.1) -749 6.65 Intergenic -3484 6.47 promoter-TSS (AT1G70710.1) -139 6.47 Intergenic -3067 6.47 Intergenic -1174 6.47 intron (AT2G29670.1, intron 2 of 2) 1857 6.11 promoter-TSS (AT5G48940.1) -4 6.11 Intergenic 3614 6.11 promoter-TSS (AT2G42110.1) -304 6.11 promoter-TSS (AT3G57010.1) -93 6.11 Intergenic -1004 6.11 Intergenic -1475 AT2G23290.1 AT3G03170.1 AT1G04610.1 AT1G22400.1 AT3G24240.1 AT3G24810.1 AT2G23050.1 AT4G03210.1 AT5G60890.1 AT4G29690.1 AT3G21720.1 AT5G47440.1 AT5G60680.1 AT3G23580.1 AT3G01840.1 AT5G56790.1 AT1G74500.1 AT2G34020.1 AT1G19850.1 AT1G70710.1 AT1G65920.1 AT5G47060.1 AT2G29670.1 AT5G48940.1 AT4G36220.1 AT2G42110.1 AT3G57010.1 AT2G26040.1 AT5G09440.1 MYB70 AT3G03170 YUC3 UGT85A1 AT3G24240 ICK3 NPY4 XTH9 MYB34 AT4G29690 ICL AT5G47440 AT5G60680 RNR2A AT3G01840 AT5G56790 BS1 AT2G34020 MP GH9B1 AT1G65920 AT5G47060 AT2G29670 AT5G48940 FAH1 AT2G42110 AT3G57010 PYL2 EXL4 9
From binding to TF regulation (to biological discovery) 1.Perform a transcript profiling experiment where the TF of interest is perturbed (inducible) overexpression knock out (T-DNA, mutant, CRISPR) 2. Identify Up and Down-regulated genes (Differential Expression [DE]) Biological questions Which genes, pathways or biological processes are regulated by TF of interest? Which genes of a multi-gene family are (not) regulated by a specific TF? Can we identify signaling cascades downstream of a specific TF? Is there evidence for indirect regulation in the TF regulated genes? Santuari et al., 2016 10
Co-expression as a gene prioritization strategy Guilt-by-association (GBA): genes with similar gene expression profiles may share similarity in regulation & function Identify candidate genes for follow-up experiments Study differentially expressed genes or ChIP targets - (co-)expression - delineate functionally coherent clusters - detect cis-regulatory elements Learn more about the specific roles of genes belonging to a certain GO category Serin et al., 2016
Co-expression Network Analysis Features Integration heterogeneous data sources Different gene-gene associations with varying quality Exploit network-guided guilt-by- association principle Methodologies Simple un-weighted/weighted graphs Probabilistic models
Plant co-expression analysis tools Serin et al., 2016 13
Measures of co-expression Gene A Gene B Gene A Gene C Expression value High correlation coefficient Low correlation coefficient Pearson correlation coefficient: (range: -1,0,1)
Other measures of co-expression Pearson correlation coefficient (PCC): measures similarity in shape of the expression profiles Spearman correlation coefficient (SCC): similar as PCC but on ranks instead of expression values Highest Reciprocal Ranks (HRR): Maximum of the two ranks (based on PCC) AB and BA HRR(AB)=max(r(AB),r(BA)) Mutual rank: geometric average of the two ranks (based on PCC) AB and BA MR(AB) = (Rank(A B) x Rank(B A))
Examples of Plant Coexpression approaches Persson et al., 2005 450 80 Score Pvalue* 400 70 350 60 300 -log(p-value;10) 50 Rank score 250 40 200 Guide-gene approach 30 150 20 100 10 50 0 0 WD-40 repeat family Glycosyl transferase Glycosyl transferase Glycosyl transferase Glycosyl transferase COP1-interacting Endo-1,4- -glucanase Leucine-rich repeat Phosphoglycerate/bisph Endomembrane protein Protein kinase family bZIP transcription Dehydration-responsive Dehydration-responsive Dehydration-responsive Mitogen-activated S-adenosylmethionine Chitinase-like protein 1 LMBR1 integral Glycerophosphoryl Methyltetrahydropteroy C2 domain-containing Phosphate translocator- Tubulin -3 (TUA5) COBRA Squalene monooxygenase Zinc finger family protein Rhomboid family protein Endomembrane protein 70 Transporter-related Expressed protein Expressed protein Expressed protein Expressed protein Expressed protein Expressed protein Cellulose synthase, CESA2 Cellulose synthase, CESA3 Cellulose synthase, CESA1 Cellulose synthase, CESA6 Ma and Bohnert, 2007 Non-targeted approach Integration stress cis- regulatory elements
Co-expression and protein-protein interaction network
