RNA-Seq Data Analysis: Mapping Reads to Transcript Abundance
Exploring RNA-Seq data analysis focusing on mapping reads and estimating transcript abundance. Key topics include read mapping speed, quantitation methods, inferences on gene expression, and a simple model for understanding transcript abundance calculation. The process involves linking mapped reads to transcript abundance for accurate gene expression analysis in RNA-Seq experiments.

Download Presentation

Please find below an Image/Link to download the presentation.
The content on the website is provided AS IS for your information and personal use only. It may not be sold, licensed, or shared on other websites without obtaining consent from the author.If you encounter any issues during the download, it is possible that the publisher has removed the file from their server.
You are allowed to download the files provided on this website for personal or commercial use, subject to the condition that they are used lawfully. All files are the property of their respective owners.
The content on the website is provided AS IS for your information and personal use only. It may not be sold, licensed, or shared on other websites without obtaining consent from the author.
E N D
Presentation Transcript
RNA Quantitation from RNA-Seq Data Jeremy Buhler for GEP Alumni Workshop
RNA-Seq Pipeline for Expression Analysis RNA-Seq Read Count per Transcript RNA Source RNA Reads 37251 20653 9827 5121 RNA Abundance per Transcript
Topics for Today Read mapping and RNA quantitation from read counts are two key computational steps in RNA-Seq expression analysis. Mapping: how do we do it fast? Quantitation: how do we get from mapped reads to transcript abundance?
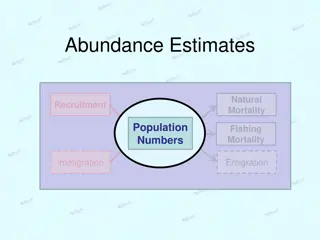
From mapped reads to transcript abundance More highly expressed transcripts should produce more RNA-Seq reads Read counts versus population of RNA transcripts Inferences we would like to make: Gene g is expressed at k copies per cell Gene g shows 2-fold higher expression than gene h Gene g shows 2-fold higher expression in sample 2 than in sample 1 Which of these inferences are feasible?
Simple model for RNA transcript abundance Transcript i iappears c ci i times in the sample Sample has M M RNA reads with length s s Sample contains n n differenttranscripts Effective length: The start position of a mapped read (with length s) cannot be at the last s-1 positions of the transcript s s- -1 1 Number of possible start positions across all RNA molecules in a sample:
Number of mapped reads versus number of copies of transcript i i fi = fraction of all starting positions for a mapped read that lie within a copy of transcript i Relationship between fi and ci: Every transcript in the sample has the same constant of proportionality:
Estimate transcript abundance from the number of mapped reads mi = number of RNA-Seq reads in the sample mapped to transcript i M = total number of RNA-Seq reads is a good estimator of : Estimate from RNA-Seq data:
Scaled version of R Ri i = RPKM RPKM = Reads Per Kilobase of transcript i per Million reads sampled: Use RPKM to compare abundance of two transcripts within a sample Ratio of abundances for transcripts i and j:
RPKM values for the same transcript are not comparable across multiple samples The same Ri values in two different samples could correspond to two different counts (c ci i) The constant of proportionality (C) depends on the quantities of other RNAs in the sample
Estimate abundance using TPM ti = fraction of all RNA molecules in a sample that are copies of transcript i By definition: Estimate ti from RNA-Seq read counts: Multiply Ti by 106 TPM = copies of Transcript i Per Million RNA molecules
Is TPM better than RPKM? TPM is no better than RPKM for comparing transcript abundance within a sample TPM are better than RPKM for comparisons across samples: Show transcript i forms a larger or smaller fraction of all transcripts in sample 2 than in sample 1 TPM does not provide the absolute number of copies of transcript i (ci) in a sample
Differential expression analysis tools Examples: DESeq2, edgeR Uses different modeling approach that compares raw read counts Normalize by sequencing depth per sample Often use the negative binomial distribution as the reference distribution
Additional considerations for RNA quantitation For paired-end reads, count fragments instead of reads (i.e., FPKM) Model fragment lengths distribution Biases due to library construction, sequencing Multi-mapped reads Different isoforms, conserved domains, repeats Unmapped reads Incomplete transcriptome / genome Sequencing errors, polymorphisms