Newtonian Noise in Gravity Gradient Measurements


EGRAAL Meeting 10/01/2018

Donatella Fiorucci
a
, Jan Harms
b
, Matteo Barsuglia
a
a
Astroparticule et Cosmologie (APC)
b
Gran Sasso Science Institute (GSSI)
Local gravity gradient noise
(Newtonian Noise)


EGRAAL Meeting 10/01/2018

Newtonian Noise frequency range in different detectors
2
aLIGO, AdVirgo, KAGRA
Einstein Telescope (ET)
Cosmic Explorer (CE)
Frequency range
≈ 10Hz – 20Hz
Frequency range
≈ 1Hz – 20Hz
Frequency range
≈ 10 mHz-1Hz
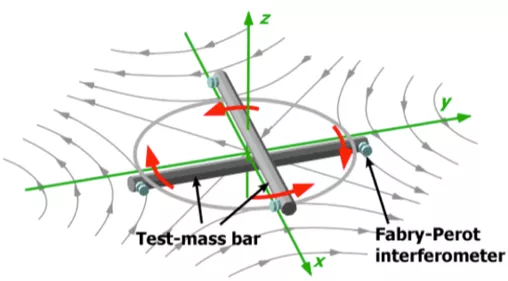
Torsion bar antennas (TOBA,
TORPEDO) and other low
frequency detectors (atom
interferometers, surconducting
gradiometers)
Newtonian Noise (NN)
Infrasound waves
1, 2, 3
δT
v(t)
Temperature fluctuations
2, 3
r(t)
m
Seismic waves
1,
2
1
Saulson
Phys. Rev. D
30
, 732
,
2
J. Harms Terrestrial Gravity Fluctuations,
3
Creigthon CQG.
25
(2008) 125011,
C.Cafaro, S. A. Ali
arXiv:0906.4844 [gr-qc]
3
EGRAAL Meeting 10/01/2018
Infrasound vs seismic NN
4
Seismic NN does
not limit the target
sensitivity of the
next-generation
gradiometers
*
*
Harms et al.
Phys. Rev. D 88 (2013)
EGRAAL Meeting 10/01/2018
Atmospheric NN
5
Infrasound NN
-
Model
- Measurement of pressure fluctuations at the Advanced Virgo (AdV) site
- AdV infrasound NN
- ET infrasound NN
- Torsion bar antenna infrasound NN
NN due to
temperature fluctuations
-
Model
- Laser interferometers (ET case)
- Torsion bar antenna
EGRAAL Meeting 10/01/2018
Infrasound NN modeling
6
Equation 1
Relation between pressure and density perturbations
Equation 2
Gravity potential perturbation
Eq. 2
is used to derive the infrasound NN both for laser interferometers and for TOBA.
*
*
Harms, Living Rev. Relativ. (2015)
Measurement of pressure fluctuations at infrasound frequencies
EGRAAL Meeting 10/01/2018
Infrasound NN modeling
7
Laser interferometer
Test mass building modeling for
laser interferometers on Earth
Test mass cavity modeling for
underground laser interferometers
The exterior and interior pressure fluctuations are assumed to be
incoherent.
TOBA
TOBA
on Earth, z
0
= 0
TOBA
underground, z
0
< 0
Building effect neglected: the cavity or building hosting the detector is
much smaller than the length of infrasound waves.
8
EGRAAL Meeting 10/01/2018
Infrasound NN modeling
9
EGRAAL Meeting 10/01/2018
Measurements of pressure spectra at the AdV site
Simplified scheme of AdV.
Solid lines: sound spectra measured at the AdV site.
Dashed yellow line: pressure fluctuation median
noise model presented in
Geophys. Res. Lett.32,
L09803.
*
*
I. Fiori, D.Fiorucci, J.Harms, F.Paoletti
Estimate of the AdV
infrasound NN, by using
sound spectra recorded
at the AdV site.
10
AdV infrasound NN
EGRAAL Meeting 10/01/2018
Infrasound NN for an ET-like detector
Infrasound NN for an ET
like laser interferometer
using the pressure
fluctuation median noise
model presented in
Geophys. Res. Lett.32,
L09803.
11
EGRAAL Meeting 10/01/2018
EGRAAL Meeting 10/01/2018
TOBA infrasound NN
TOBA infrasound NN for
different detector depth
using the pressure
fluctuation median noise
model presented in
Geophys. Res. Lett.32,
L09803.
12
Contributions to the
infrasound NN of a TOBA
detector located 300 m
beneath the earth
surface. Blue line:
contribution due to the
space inside the
underground cavity
housing the detector.
Green line: contribution
of the space above the
earth surface.
13
TOBA infrasound NN - Cavity/building effect
EGRAAL Meeting 10/01/2018
EGRAAL Meeting 10/01/2018
Atmospheric NN
14
Infrasound NN
-
Model
- Measurement of pressure fluctuations at the Advanced Virgo (AdV) site
- AdV infrasound NN
- ET infrasound NN
- Torsion bar antenna infrasound NN
NN due to
temperature fluctuations
-
Model
- Laser interferometer (ET case)
- Torsion bar antennas
15
Temperature fluctuation NN-ET
EGRAAL Meeting 10/01/2018
*
Uniform airflow 20 m/s
credit
:
Jan Harms
*
Harms, Living Rev. Relativ. (2015)
Temperature fluctuation NN-TOBA
y
TOBA orientation
Wind speed, v=10m/s, along the x axis
x
Preliminary!
Probably
overestimated
Turbulent mixing theory
breaks down at f ≤ few
tens of mHz
1
Gravimeter data show
that this noise is
overestimated by few
orders of magnitude at
10mHz
2
Validity of the model for
10 mHz < f < hundreds of
mHz must be checked
Model should be ok (but
simplified) for f ≥ 1 Hz.
Warning!
1
Kukharets, V.P. and Nalbandyan, H.G.
Izv., Atmos. Ocean. Phys
., 42, (2006)
2
Hinderer, Crossley, Warburton, Gravimetric Methods, 2007 Elsevier B.V.
16
17
EGRAAL Meeting 10/01/2018
Conclusion and Perspectives
Infrasound NN
Pressure fluctuations variate significantly with location, time and season. It is
important to characterize the detector sites in terms of pressure fluctuations.
Characterization of the AdV site in terms of pressure fluctuations and infrasound NN
level.
For an ET-like detector the Infrasound NN is strongly suppressed, when going
underground. However the attenuation can be significantly spoiled by the internal
contribution of the test mass cavity.
TOBA infrasound NN is below the next stage sensitivity and a few orders of magnitude
above the sensitivity required for gravitational-wave detection. This allows the
exploitation for geophysical applications.
TOBA NN from Temperature fluctuations
Check and improve the model.
Strongly attenuated when going underground.
Investigating the impact of Newtonian Noise (NN) on various detectors and instruments used for measuring gravity gradients. The content delves into the frequency ranges affected by NN in detectors like LIGO, AdVirgo, and KAGRA, as well as the influence of infrasound and seismic waves. The discussion extends to atmospheric NN modeling and the implications for laser interferometers and torsion bar antennas. Through detailed equations and modeling, the challenges and strategies in mitigating NN interference are explored.

Download Presentation

Please find below an Image/Link to download the presentation.
The content on the website is provided AS IS for your information and personal use only. It may not be sold, licensed, or shared on other websites without obtaining consent from the author.If you encounter any issues during the download, it is possible that the publisher has removed the file from their server.
You are allowed to download the files provided on this website for personal or commercial use, subject to the condition that they are used lawfully. All files are the property of their respective owners.
The content on the website is provided AS IS for your information and personal use only. It may not be sold, licensed, or shared on other websites without obtaining consent from the author.
E N D
Presentation Transcript
Local gravity gradient noise (Newtonian Noise) Donatella Fioruccia, Jan Harmsb, Matteo Barsugliaa aAstroparticule et Cosmologie (APC) b Gran Sasso Science Institute (GSSI) EGRAAL Meeting 10/01/2018
Newtonian Noise frequency range in different detectors Frequency range 10Hz 20Hz aLIGO, AdVirgo, KAGRA Einstein Telescope (ET) Cosmic Explorer (CE) Frequency range 1Hz 20Hz Torsion bar antennas (TOBA, TORPEDO) and other low frequency detectors (atom interferometers, surconducting gradiometers) Frequency range 10 mHz-1Hz EGRAAL Meeting 10/01/2018 2
Newtonian Noise (NN) T Infrasound waves 1, 2, 3 v(t) Temperature fluctuations 2, 3 m Seismic waves1, 2 1Saulson Phys. Rev. D 30, 732, 3Creigthon CQG. 25 (2008) 125011, C.Cafaro, S. A. Ali arXiv:0906.4844 [gr-qc] 2J. Harms Terrestrial Gravity Fluctuations, 3
Infrasound vs seismic NN * Seismic NN does not limit the target sensitivity of the next-generation gradiometers *Harms et al. Phys. Rev. D 88 (2013) EGRAAL Meeting 10/01/2018 4
Atmospheric NN Infrasound NN - Model - Measurement of pressure fluctuations at the Advanced Virgo (AdV) site - AdV infrasound NN - ET infrasound NN - Torsion bar antenna infrasound NN NN due to temperature fluctuations - Model - Laser interferometers (ET case) - Torsion bar antenna EGRAAL Meeting 10/01/2018 5
Infrasound NN modeling Equation 1 Relation between pressure and density perturbations Equation 2 Gravity potential perturbation * Measurement of pressure fluctuations at infrasound frequencies Eq. 2 is used to derive the infrasound NN both for laser interferometers and for TOBA. * Harms, Living Rev. Relativ. (2015) EGRAAL Meeting 10/01/2018 6
Infrasound NN modeling Laser interferometer Test mass building modeling for laser interferometers on Earth Test mass cavity modeling for underground laser interferometers The exterior and interior pressure fluctuations are assumed to be incoherent. EGRAAL Meeting 10/01/2018 7
Infrasound NN modeling TOBA TOBA on Earth, z0 = 0 TOBA underground, z0 < 0 Building effect neglected: the cavity or building hosting the detector is much smaller than the length of infrasound waves. EGRAAL Meeting 10/01/2018 8
Measurements of pressure spectra at the AdV site * Simplified scheme of AdV. Solid lines: sound spectra measured at the AdV site. Dashed yellow line: pressure fluctuation median noise model presented in Geophys. Res. Lett.32, L09803. *I. Fiori, D.Fiorucci, J.Harms, F.Paoletti EGRAAL Meeting 10/01/2018 9
AdV infrasound NN Estimate of the AdV infrasound NN, by using sound spectra recorded at the AdV site. EGRAAL Meeting 10/01/2018 10
Infrasound NN for an ET-like detector Infrasound NN for an ET like laser interferometer using the pressure fluctuation median noise model presented in Geophys. Res. Lett.32, L09803. EGRAAL Meeting 10/01/2018 11
TOBA infrasound NN TOBA infrasound NN for different detector depth using the pressure fluctuation median noise model presented in Geophys. Res. Lett.32, L09803. EGRAAL Meeting 10/01/2018 12
TOBA infrasound NN - Cavity/building effect Contributions to the infrasound NN of a TOBA detector located 300 m beneath the earth surface. Blue line: contribution due to the space inside the underground cavity housing the detector. Green line: contribution of the space above the earth surface. EGRAAL Meeting 10/01/2018 13
Atmospheric NN Infrasound NN - Model - Measurement of pressure fluctuations at the Advanced Virgo (AdV) site - AdV infrasound NN - ET infrasound NN - Torsion bar antenna infrasound NN NN due to temperature fluctuations - Model - Laser interferometer (ET case) - Torsion bar antennas EGRAAL Meeting 10/01/2018 14
Temperature fluctuation NN-ET * Uniform airflow 20 m/s credit: Jan Harms * Harms, Living Rev. Relativ. (2015) EGRAAL Meeting 10/01/2018 15
Temperature fluctuation NN-TOBA TOBA orientation y Wind speed, v=10m/s, along the x axis x Turbulent mixing theory breaks down at f few tens of mHz 1 Gravimeter data show that this noise is overestimated by few orders of magnitude at 10mHz 2 Preliminary! Probably overestimated Validity of the model for 10 mHz < f < hundreds of mHz must be checked Warning! Model should be ok (but simplified) for f 1 Hz. 1Kukharets, V.P. and Nalbandyan, H.G. Izv., Atmos. Ocean. Phys., 42, (2006) 2Hinderer, Crossley, Warburton, Gravimetric Methods, 2007 Elsevier B.V. 16
Conclusion and Perspectives Infrasound NN Pressure fluctuations variate significantly with location, time and season. It is important to characterize the detector sites in terms of pressure fluctuations. Characterization of the AdV site in terms of pressure fluctuations and infrasound NN level. For an ET-like detector the Infrasound NN is strongly suppressed, when going underground. However the attenuation can be significantly spoiled by the internal contribution of the test mass cavity. TOBA infrasound NN is below the next stage sensitivity and a few orders of magnitude above the sensitivity required for gravitational-wave detection. This allows the exploitation for geophysical applications. TOBA NN from Temperature fluctuations Check and improve the model. Strongly attenuated when going underground. EGRAAL Meeting 10/01/2018 17


")