Intensity Noise and Angular Distribution Measurements in LED Selection
The measurements focus on intensity noise and angular distribution to address variations in LED performance observed in LIGO papers. The study aims to investigate intensity noise dependence on LED current, differences between LED batches, and comparisons between them.

Download Presentation

Please find below an Image/Link to download the presentation.
The content on the website is provided AS IS for your information and personal use only. It may not be sold, licensed, or shared on other websites without obtaining consent from the author.If you encounter any issues during the download, it is possible that the publisher has removed the file from their server.
You are allowed to download the files provided on this website for personal or commercial use, subject to the condition that they are used lawfully. All files are the property of their respective owners.
The content on the website is provided AS IS for your information and personal use only. It may not be sold, licensed, or shared on other websites without obtaining consent from the author.
E N D
Presentation Transcript
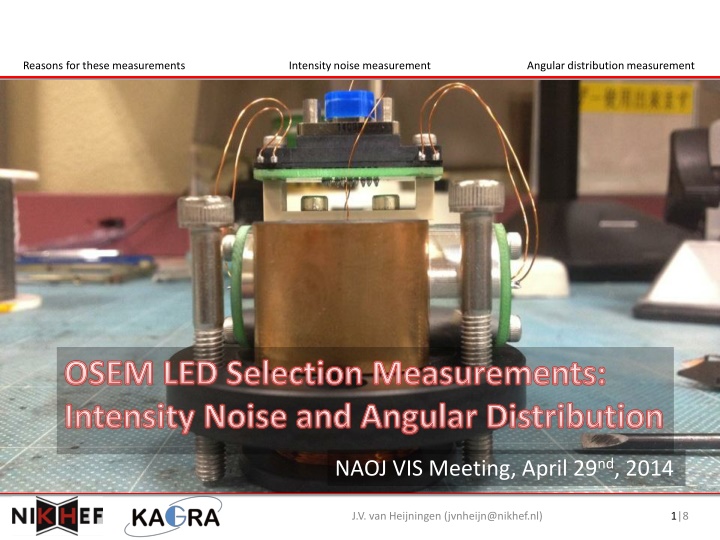
Reasons for these measurements Intensity noise measurement Angular distribution measurement OSEM LED Selection Measurements: Intensity Noise and Angular Distribution NAOJ VIS Meeting, April 29nd, 2014 J.V. van Heijningen (jvnheijn@nikhef.nl) 1|8
Results from OSEMs last November (1/2) Reasons for these measurements Intensity noise measurement Angular distribution measurement LIGO papers have shown that OP232 LED intensity noise varies from batch to batch J.V. van Heijningen (jvnheijn@nikhef.nl) 2|8
Results from OSEMs last November (1/2) Reasons for these measurements Intensity noise measurement Angular distribution measurement In addition, LIGO papers show different angular distribution and peak locations for different LEDs J.V. van Heijningen (jvnheijn@nikhef.nl) 3|8
Measurement set-up Reasons for these measurements Intensity noise measurement Angular distribution measurement Determined with the first (!) fully assembled OSEM what current to run the LED, now with collimator, to have -12V on UTIA output: Rs,LED= 300 ULED= 8V ILED 25mA For fast comparative measurement, LED is run in a simple set-up at 25 mA and ASD on the UTIAsignal is taken First, a dependence of intensity noise on the LED intensity magnitude is investigated J.V. van Heijningen (jvnheijn@nikhef.nl) 4|8
Intensity noise LED current dependence Reasons for these measurements Intensity noise measurement Angular distribution measurement J.V. van Heijningen (jvnheijn@nikhef.nl) 5|8
Intensity noise first batch of LEDs Reasons for these measurements Intensity noise measurement Angular distribution measurement J.V. van Heijningen (jvnheijn@nikhef.nl) 6|8
Comparison between batches Reasons for these measurements Intensity noise measurement Angular distribution measurement J.V. van Heijningen (jvnheijn@nikhef.nl) 7|8
Measurement set-up Reasons for these measurements Intensity noise measurement Angular distribution measurement Lens (f = 8mm) LED CCD Camera J.V. van Heijningen (jvnheijn@nikhef.nl) 8|8

")
")