Monitoring Faroe Current Transport with Satellite Altimetry and In-situ Observations
Combining satellite altimetry and in-situ observations offers a comprehensive approach to monitoring volume, heat, and salt transports in the Faroe Current. The study focuses on the representativeness of ocean observations in the Arctic and Subarctic regions, highlighting the importance of combining different data sources for accurate analysis. Various images and data sets are presented, showcasing the integration of satellite altimetry with in-situ measurements to analyze ocean currents and temperature profiles. Correlations between different measurement techniques are also discussed, providing insights into the monitoring of water masses in the North Atlantic.
Download Presentation

Please find below an Image/Link to download the presentation.
The content on the website is provided AS IS for your information and personal use only. It may not be sold, licensed, or shared on other websites without obtaining consent from the author.If you encounter any issues during the download, it is possible that the publisher has removed the file from their server.
You are allowed to download the files provided on this website for personal or commercial use, subject to the condition that they are used lawfully. All files are the property of their respective owners.
The content on the website is provided AS IS for your information and personal use only. It may not be sold, licensed, or shared on other websites without obtaining consent from the author.
E N D
Presentation Transcript
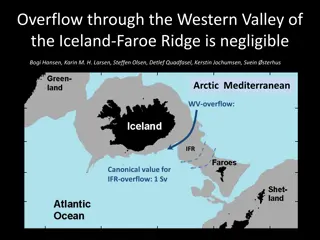
Combining satellite altimetry and in situ observations to monitor transports of volume, heat, and salt in the Faroe Current in situ or Altimetry ? focus topics: 1. Representativeness of ocean observations Arctic Subarctic Ocean Fluxes Bogi Hansen, Karin M. H. Larsen, Svein sterhus Greenland Nordic Seas 0.9 Sv Monitoring section Iceland 3.8 Sv 48% Faroe Current 2.7 Sv Faroes Shet- land 0.6 Sv North Atlantic sterhus et al. (2019) image:AGU 2003
Atlantic water on the monitoring section A2 A3 A4 A5 A6 A7 A8 Average temperature from 78 CTD cruises Atlantic 35.0 psu 4 C Arctic ADCPs: 1997-2018
In situ observations Iceland
Weekly averaged volume transport 1997-2013 based on in-situ observations Satellite altimetry Sea level difference across the flow
Comparison ADCP - Altimetry > 70% volume transport Correlation ADCP-Altimetry: 28-day averages Correlation combined ADCP-Altimetry: 0.86 0.280.78 0.61 0.73 Atlantic water 0.16 +0.43 +0.17 +0.24 0.17 0.64 0.34 Correlation ADCP-ADCP: 28-day averages ADCP obs.: 2706 days 94 values 28-day averages
Altimetry variations represent surface velocity from Aviso+ MDT NO NO NO NO from ADCP & CTD H(t) L U0(cm/s): 11.7 21.3 17.1 10 9 After calibration with ADCP & CTD observations, Altimetry SLA-values give surface velocities But, what about sub-surface velocities ????????
Vertical integral of ADCP velocity Volume transport down to fixed depths can also be determined from altimetry, solely Atlantic water DA 0.99 0.91 0.99 0.97 Correlation q(t) versus U(0,t)
Temperature from up to 95 CTD cruises Standard CTD station Average 4 C isotherm Atlantic water How much of the variance in the lower boundary of Atlantic layer can be explained by Altimetry Arctic water Bottom temperature 17% 34% 42% 60% 48% 30% 25% 16% explained by Altimetry 50% explained by Bottom temp.
TEmperature Longterm Logging by BOttom Grounded Instrumentation Acoustic modem Battery capacity > 5 years Temperature sensor
We still need in situ observations to monitor the Faroe Current But, satellite altimetry reduces the need considerably, once calibrated by in situ observations Greenland Iceland Faroe Current 2.7 Sv Faroes Shet- land Funding agencies: The Danish Energy Agency as part of the Arctic Climate Support Programme. & EU Horizon 2020 research and innovation programme under grant agreement No 727852 (Blue-Action). image:AGU 2003


