Insights on Overflow through the Western Valley of the Iceland-Faroe Ridge
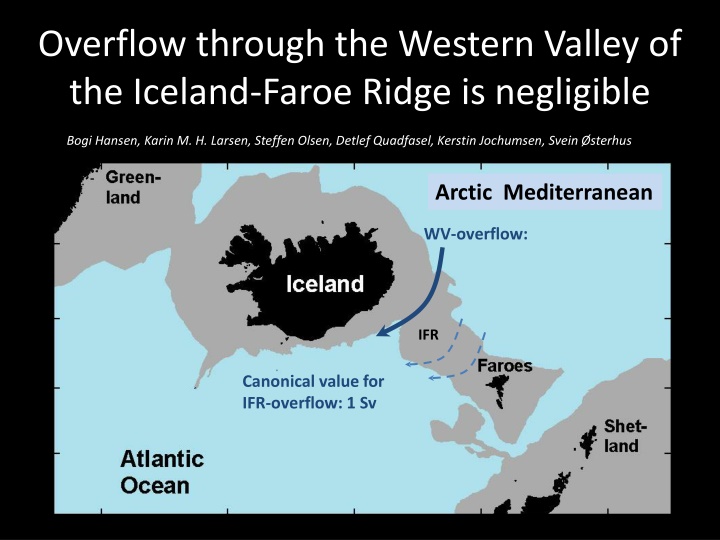
Research by Bogi Hansen, Karin M. H. Larsen, Steffen Olsen, Detlef Quadfasel, Kerstin Jochumsen, and Svein Østerhus delves into the negligible overflow through the Western Valley of the Iceland-Faroe Ridge. Various field experiments and data analyses demonstrate minimal flow through the Western Valley, with no evidence of significant overflow. The study includes details on temperature profiles, ADCP measurements, transport density calculations, and factors affecting the overflow dynamics such as shear, friction, and pressure gradients.

Download Presentation

Please find below an Image/Link to download the presentation.
The content on the website is provided AS IS for your information and personal use only. It may not be sold, licensed, or shared on other websites without obtaining consent from the author.If you encounter any issues during the download, it is possible that the publisher has removed the file from their server.
You are allowed to download the files provided on this website for personal or commercial use, subject to the condition that they are used lawfully. All files are the property of their respective owners.
The content on the website is provided AS IS for your information and personal use only. It may not be sold, licensed, or shared on other websites without obtaining consent from the author.
E N D
Presentation Transcript
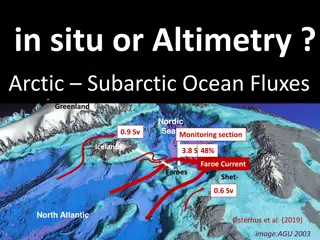
Overflow through the Western Valley of the Iceland-Faroe Ridge is negligible Bogi Hansen, Karin M. H. Larsen, Steffen Olsen, Detlef Quadfasel, Kerstin Jochumsen, Svein sterhus Arctic Mediterranean WV-overflow: IFR Canonical value for IFR-overflow: 1 Sv
Western Valley overflow Perkins et al. (1998): find no evidence for significant flow through the WV Upstream interface 300m above Western Valley sill Field experiment 2016-2017 Strong Perkins et al. (1998): Strong bottom current Persistent Quadfasel: ADCP moored 2 years
WOW field experiment 3 moorings, 278 days Temperature during recovery cruise May 2017 Width < 20 km Bottom temperature Bottom temperature ADCP
278 daily averaged ADCP profiles ADCP Average velocity = ( ) q U z dz Transport density: Overall average: <q> = 1.5 m2/s Volume transport: (Transport density) (Width) Overflow (1.5 m2/s) (20 km) 0.03 Sv
Height of overflow layer above ADCP Transport density: h = h0 + h1 h2 L h2 h1 = (3 C TA) 31m h1 h2 = L tan( ) h 3 C tan( ) is calculated from velocity shear by Thermal Wind Eq. h0 hC TC Correlation between hC and TC is -0.73
Transport density at ADCP site Weekly averaged transport density: Atlantic inflow blocks WV-overflow = ( ) q U z dz Friction between inflow and overflow Thermal wind equation: Strong shear gives thin overflow layer Sea level difference generates barotropic pressure gradient R = -0.64 Inflow weak Inflow strong Atlantic inflow
Thermal wind equation A thinner overlow layer is more sensitive to bottom friction Weak Atlantic inflow Strong Atlantic inflow Weak shear Strong shear
Mean Dynamic Topography Barotropic pressure gradient . Upstream Upstream 0 D pS pU U 0+ Sill 1 0 Bernoulli: U2= (pU pS) = g ( D - ) 0 ) 1 2000 200m - 10 cm = 0
During the period of our field experiment, the average WV-overflow was < 0.03 Sv Was the period perhaps abnormal ???????
Satellite altimetry Overflow transport density at ADCP site is correlated with velocity at 135m depth: R = - 0.64 Velocity at 135m depth is correlated with sea level tilt from satellite altimetry: R = 0.86 Overflow transport density at ADCP site is correlated with sea level tilt : R = - 0.60 This allows regression to reproduce overflow transport density for whole altimetry period Average overflow 1993 - 2016 Transport density < 5 m2/s Average Field Exp. Volume transport: (Transport density) (Width) 0.1 Sv
Total Iceland-Faroe Ridge overflow <0.1 Sv ? 0.3 Sv Beaird et al. (2013)
Funding agencies: The Danish Energy Agency as part of the Arctic Climate Support Programme (Western Valley Overflow project). RACE II Regional Atlantic Circulation and Global Change funded by the German Federal Ministry for Education and Research (BMBF), F rderkennzeichen 03F0729B. The Blue-Action project has received funding from the European Union's Horizon 2020 research and innovation programme under grant agreement No 727852.