Marine Protected Areas: Implementation of New METT Tool
The implementation of the new METT (Management Effectiveness Tracking Tool) version 3 in Marine Protected Areas (MPAs) is crucial for assessing progress and ensuring effective management. This transition addresses issues of data reliability, verification, and consistency across different authorities. By developing a standardized tool (METT-SA version 03), a more accurate and consistent assessment process can be established nationwide, ultimately improving the management and conservation of MPAs.

Download Presentation

Please find below an Image/Link to download the presentation.
The content on the website is provided AS IS for your information and personal use only. It may not be sold, licensed, or shared on other websites without obtaining consent from the author. If you encounter any issues during the download, it is possible that the publisher has removed the file from their server.
You are allowed to download the files provided on this website for personal or commercial use, subject to the condition that they are used lawfully. All files are the property of their respective owners.
The content on the website is provided AS IS for your information and personal use only. It may not be sold, licensed, or shared on other websites without obtaining consent from the author.
E N D
Presentation Transcript
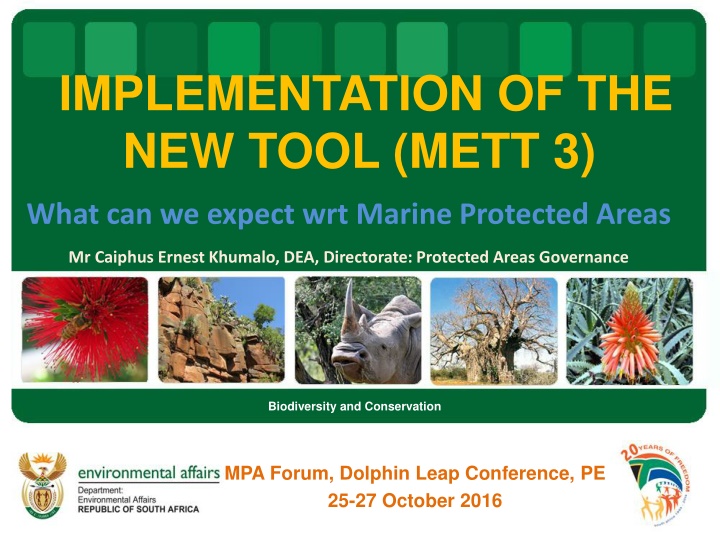
IMPLEMENTATION OF THE NEW TOOL (METT 3) What can we expect wrt Marine Protected Areas Mr Caiphus Ernest Khumalo, DEA, Directorate: Protected Areas Governance Biodiversity and Conservation MPA Forum, Dolphin Leap Conference, PE 25-27 October 2016
Introduction Since the 2010 baseline assessment RSA has been submitting METT data to DEA Ambitious target of 60% of state managed PA to have a METT score above 67% by 2015 was once set From the baseline, progress was monitored against target All MAs required to conduct annual assessments Results are collated, pooled & analysed by DEA to determine the national score
Data Verification & Determination of Reliability Index The trends were satisfactory but the issue of reliability of the data remained elusive DEA saw a need to test the reliability of the submitted scores owing to the fact that the process was also through self- assessment To determine whether increase was attributed to applied interventions or to contrived score increase. DEA then commissioned verification/audit for 2013 data
Number of auditors assigned & the version of METT-SA used per MA
Possible Reasons for Changing Scores Subjectivity Setting of targets Linking the key performance indicators (KPI) of managers to target scores. Comparison of scores between organizations. Submission of consistently lower scores being used as a call for assistance. The gap in the auditing of scores between 2010- 2014.
Introduction & Implementation of METT 3 CMAs opted to adapt/change the tool into different versions The national analysis was therefore undertaken using incompatible data source To circumvent this, a need to develop a single tool was crucial as a step forward. Consultative process with provinces undertaken to develop the new tool (METT-SA version 03)
Implications of METT 3 Scores will most likely decline. Need to introduce more thorough supplementary evaluations-e.g State of Biodiversity, etc. It will take longer to complete. Verification documents must be supplied and noted.
2014 CBD METT Report 2016 CBD METT Report New Tool Results
Interpretation of results, discussion & conclusion It would appear that the results conform with the anticipated decline of the scores which was envisaged to respond to the rigidity of the new tool It was however, interesting to note that cumulatively the aggregate drop at national level was as high as 20%. Should be taken in the good light as it reflects a rather more reliable picture from a more robust system developed by the country Furthermore, it should also be noted that the drop did not subside the minimum level of 67% but still at 72% in terms of the area based analysis The new approach in terms of categorization of scores also call for sound management as opposed to 100% effectiveness Because of this, focus should be in the monitoring and maintenance of the score above 67% and also possible achievement of increasing above 72% moving to the future
What is expected for MPAs? Hectares (2015) 2014 65957 2310 7 196 3617 Management Authority MPA's Name CapeNature CapeNature CapeNature CapeNature CapeNature CapeNature CapeNature CapeNature DEA DEA DEA DEA DEA DEA DEA ECPTA ECPTA ECPTA ECPTA EKNZW EKNZW SANParks SANParks iSimangaliso iSimangaliso 2010 2011 2012 2013 2014 2015 na na na 54 65 73 55 63 66 66 70 77 63 75 81 41 55 63 Betty's bay MPA De Hoop MPA Goukamma MPA Lamberts Bay Bird Island Robberg MPA Walker Bay Whale MPA Still baai MPA Helderberg MPA Prince Edward Island Jutten Island Malgas Island Sardinia Sixteen Mile Beach Langabaan Lagoon Marcus Island Dwesa - Cwebe MPA East London Coast MPA Hluleka MPA Mkhambathi MPA Aliwal Shoal MPA Trafalgar MPA Table Mountain National Park Tsitsikamma MPA Maputaland MPA St Lucia na 71 68 75 87 68 na 75 71 74 80 68 69 70 67 69 74 68 33601 84 84 na na na na 5376 2324 609 7635 37 28 37 36 46 47 55 61 60 50 65 77 68 67 68 81 58 71 74 82 53 59 59 66 21613 75 75 na 73 73 68