LPL Research Outlook 2020: Market Insights and Forecasts
Explore the LPL Research Outlook 2020 report presented by John Lynch, Chief Investment Strategist at LPL Financial. The report provides an overview of market forecasts, economic indicators, and investment opportunities for the year ahead. Key topics include GDP growth projections, inflation trends, wage growth impact on spending, and analysis of bond and stock markets. Gain valuable insights to make informed decisions in the financial landscape.
Download Presentation

Please find below an Image/Link to download the presentation.
The content on the website is provided AS IS for your information and personal use only. It may not be sold, licensed, or shared on other websites without obtaining consent from the author.If you encounter any issues during the download, it is possible that the publisher has removed the file from their server.
You are allowed to download the files provided on this website for personal or commercial use, subject to the condition that they are used lawfully. All files are the property of their respective owners.
The content on the website is provided AS IS for your information and personal use only. It may not be sold, licensed, or shared on other websites without obtaining consent from the author.
E N D
Presentation Transcript
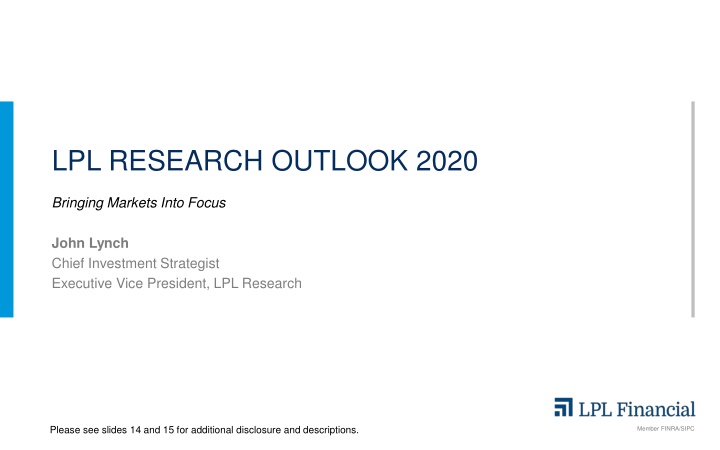
LPL RESEARCH OUTLOOK 2020 Bringing Markets Into Focus John Lynch Chief Investment Strategist Executive Vice President, LPL Research LPL Financial Member FINRA/SIPC Member FINRA/SIPC Please see slides 14 and 15 for additional disclosure and descriptions. 1
2020 FORECASTS Year-over-Year Real GDP Growth 2018 2019 (LPL Est.)* 2020 (LPL Est.)* U.S. 2.9% 2.0% 1.75% Developed ex-U.S. 1.9% 1.3% 1.5% Emerging Markets 4.5% 3.9% 4.6% Global 3.6% 3.5% 3.5% U.S. Markets 2019 (LPL Est.)* 2020 (LPL Est.)* 10-Year U.S. Treasury Yield 1.75 2% 2 2.25% S&P 500 EPS $165 $175 S&P 500 Fair Value 3,000 3,250 3,300 Source: LPL Research, Bloomberg, International Monetary Fund (IMF) 10/16/19 2019 U.S. economic data, U.S. GDP estimate, and global GDP estimate are LPL forecasts. Other GDP estimates are IMF projections. LPL Financial Member FINRA/SIPC 3
ECONOMY: GDP GROWTH HAS SLOWED, BUT MAY REMAIN STEADY LPL Financial Member FINRA/SIPC 4
ECONOMY: WHOLESALE PRICES MAY HELP CONTAIN INFLATION LPL Financial Member FINRA/SIPC 5
ECONOMY: SOLID WAGE GROWTH SUPPORTS SPENDING LPL Financial Member FINRA/SIPC 6
POLICY: FED RATE REMAINS ABOVE OTHER CENTRAL BANKS LPL Financial Member FINRA/SIPC 7
BONDS: SHORT-LIVED YIELD CURVE INVERSION IS LESS WORRISOME LPL Financial Member FINRA/SIPC 8
BONDS: NEGATIVE-YIELDING DEBT LPL Financial Member FINRA/SIPC 9
STOCKS: EARNINGS GROWTH POISED TO ACCELERATE IN 2020 LPL Financial Member FINRA/SIPC 10
STOCKS: U.S. & EM MAY LEAD GROWTH LPL Financial Member FINRA/SIPC 11
OUR VIEW LPL Financial Member FINRA/SIPC 12
ELECTION 2020: CAN STOCKS PREDICT THE NEXT PRESIDENT? Incumbent Party Won 28 32 36 40 44 48 52 56 60 64 68 72 76 80 84 88 92 96 00 04 08 12 16 15% 10% 5% 0% Incumbent Party Lost -5% Stocks were up significantly ahead of the election, but Ronald Reagan beat Jimmy Carter s bid for a second term, as high inflation in the late 1970s ate away at voter confidence. Strong economic growth in the mid-1950s helped Dwight D. Eisenhower win a second term, although stocks were lower ahead of the election. -10% -15% While stocks were up heading into the election, Democrats had held the presidency for the previous eight years, and that, plus civil unrest in 1968, helped Richard Nixon win. -20% -25% Source: LPL Research, Strategas Research Partners 07/15/19 *Except in 1956, 1968, and 1980 The modern design of the S&P 500 stock index was first launched in 1957. Performance back to 1928 incorporates the performance of predecessor index, the S&P 90. All indexes are unmanaged and cannot be invested into directly. Past performance is no guarantee of future results. Stock Market Accurately Predicts Incumbent Party Win or Loss Stock Market Fails To Predict Incumbent Party Win or Loss LPL Financial Member FINRA/SIPC 13
IMPORTANT DISCLOSURES Risks: Investing involves risks including possible loss of principal. No investment strategy or risk management technique can guarantee return or eliminate risk in all market environments. Investing in foreign and emerging markets involves special additional risks. These risks include, but are not limited to, currency risk, geopolitical risk, and risk associated with varying accounting standards. Investing in emerging markets may accentuate these risks. U.S. Treasuries may be considered safe haven investments but do carry some degree of risk including interest rate, credit, and market risk. They are guaranteed by the U.S. government as to the timely payment of principal and interest and, if held to maturity, offer a fixed rate of return and fixed principal value. Definitions: The S&P 500 Index is a capitalization-weighted index of 500 stocks designed to measure performance of the broad domestic economy through changes in the aggregate market value of 500 stocks representing all major industries. All indexes are unmanaged and cannot be invested into directly. Unmanaged index returns do not reflect fees, expenses, or sales charges. Index performance is not indicative of the performance of any investment. Earnings per share (EPS) is the portion of a company s profit allocated to each outstanding share of common stock. EPS serves as an indicator of a company s profitability. EPS is generally considered to be the single most important variable in determining a share s price. It is also a major component used to calculate the price-to-earnings valuation ratio. The price-to-earnings (P/E) ratio is a measure of the price paid for a share relative to the annual net income or profit earned by the firm per share. It is a financial ratio used for valuation: a higher P/E ratio means that investors are paying more for each unit of net income, so the stock is more expensive compared to one with lower P/E ratio. Price to forward Earnings is a measure of the P/E ratio using forecasted earnings for the P/E calculation. Gross domestic product (GDP) is the monetary value of all the finished goods and services produced within a country s borders in a specific time period, though GDP is usually calculated on an annual basis. It includes all of private and public consumption, government outlays, investments, and exports less imports that occur within a defined territory. LPL Financial Member FINRA/SIPC 14
IMPORTANT INFORMATION Please see the full Outlook 2020 publication for additional description and disclosure. The opinions and forecasts voiced in this material are for general information only and are not intended to provide specific financial advice or recommendations for any individual. The economic forecasts are subject to change and may not develop as predicted. To determine which investment(s) may be appropriate for you, please consult your financial professional prior to investing. All information is believed to be from reliable sources; however, we make no representation as to its completeness or accuracy. Securities and advisory services offered through LPL Financial (LPL), a registered investment advisor and broker- dealer (member FINRA/SIPC). Insurance products are offered through LPL or its licensed affiliates. To the extent you are receiving investment advice from a separately registered independent investment advisor, please note that LPL is not an affiliate of and makes no representation with respect to such entity. If your advisor is located at a bank or credit union, please note that the bank/credit union is not registered as a broker-dealer or investment advisor. Registered representatives of LPL may also be employees of the bank/credit union. These products and services are being offered through LPL or its affiliates, which are separate entities from, and not affiliates of, the bank/credit union. Securities and insurance offered through LPL or its affiliates are: Not Insured by FDIC/NCUA or Any Other Government Agency | Not Bank/Credit Union Guaranteed Not Bank/Credit Union Deposits or Obligations | May Lose Value RES-19014-1119 | For Public Use | Tracking # 1-919668 (Exp. 12/20) LPL Financial Member FINRA/SIPC 15
