Linear Regression
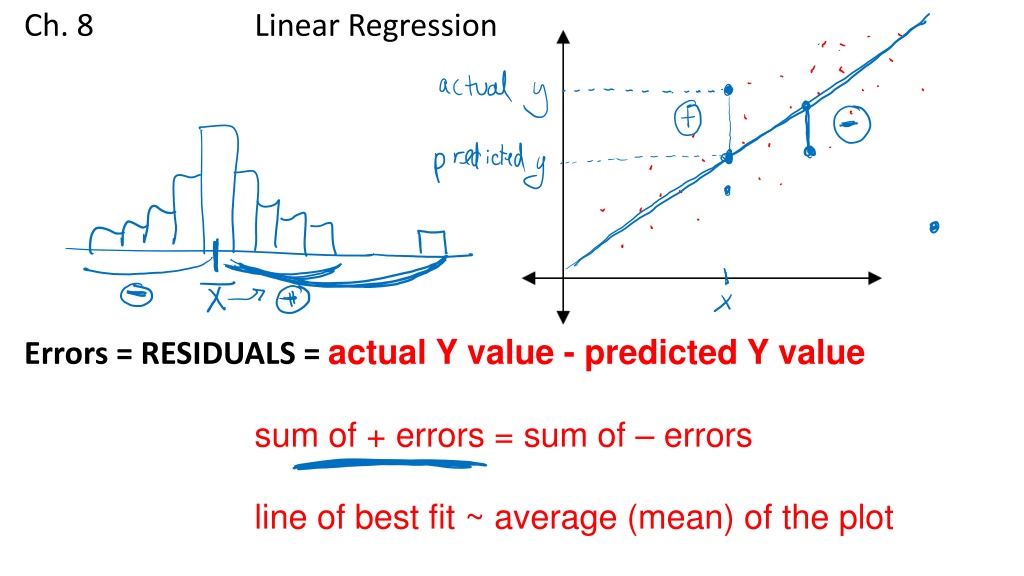

Ch. 8
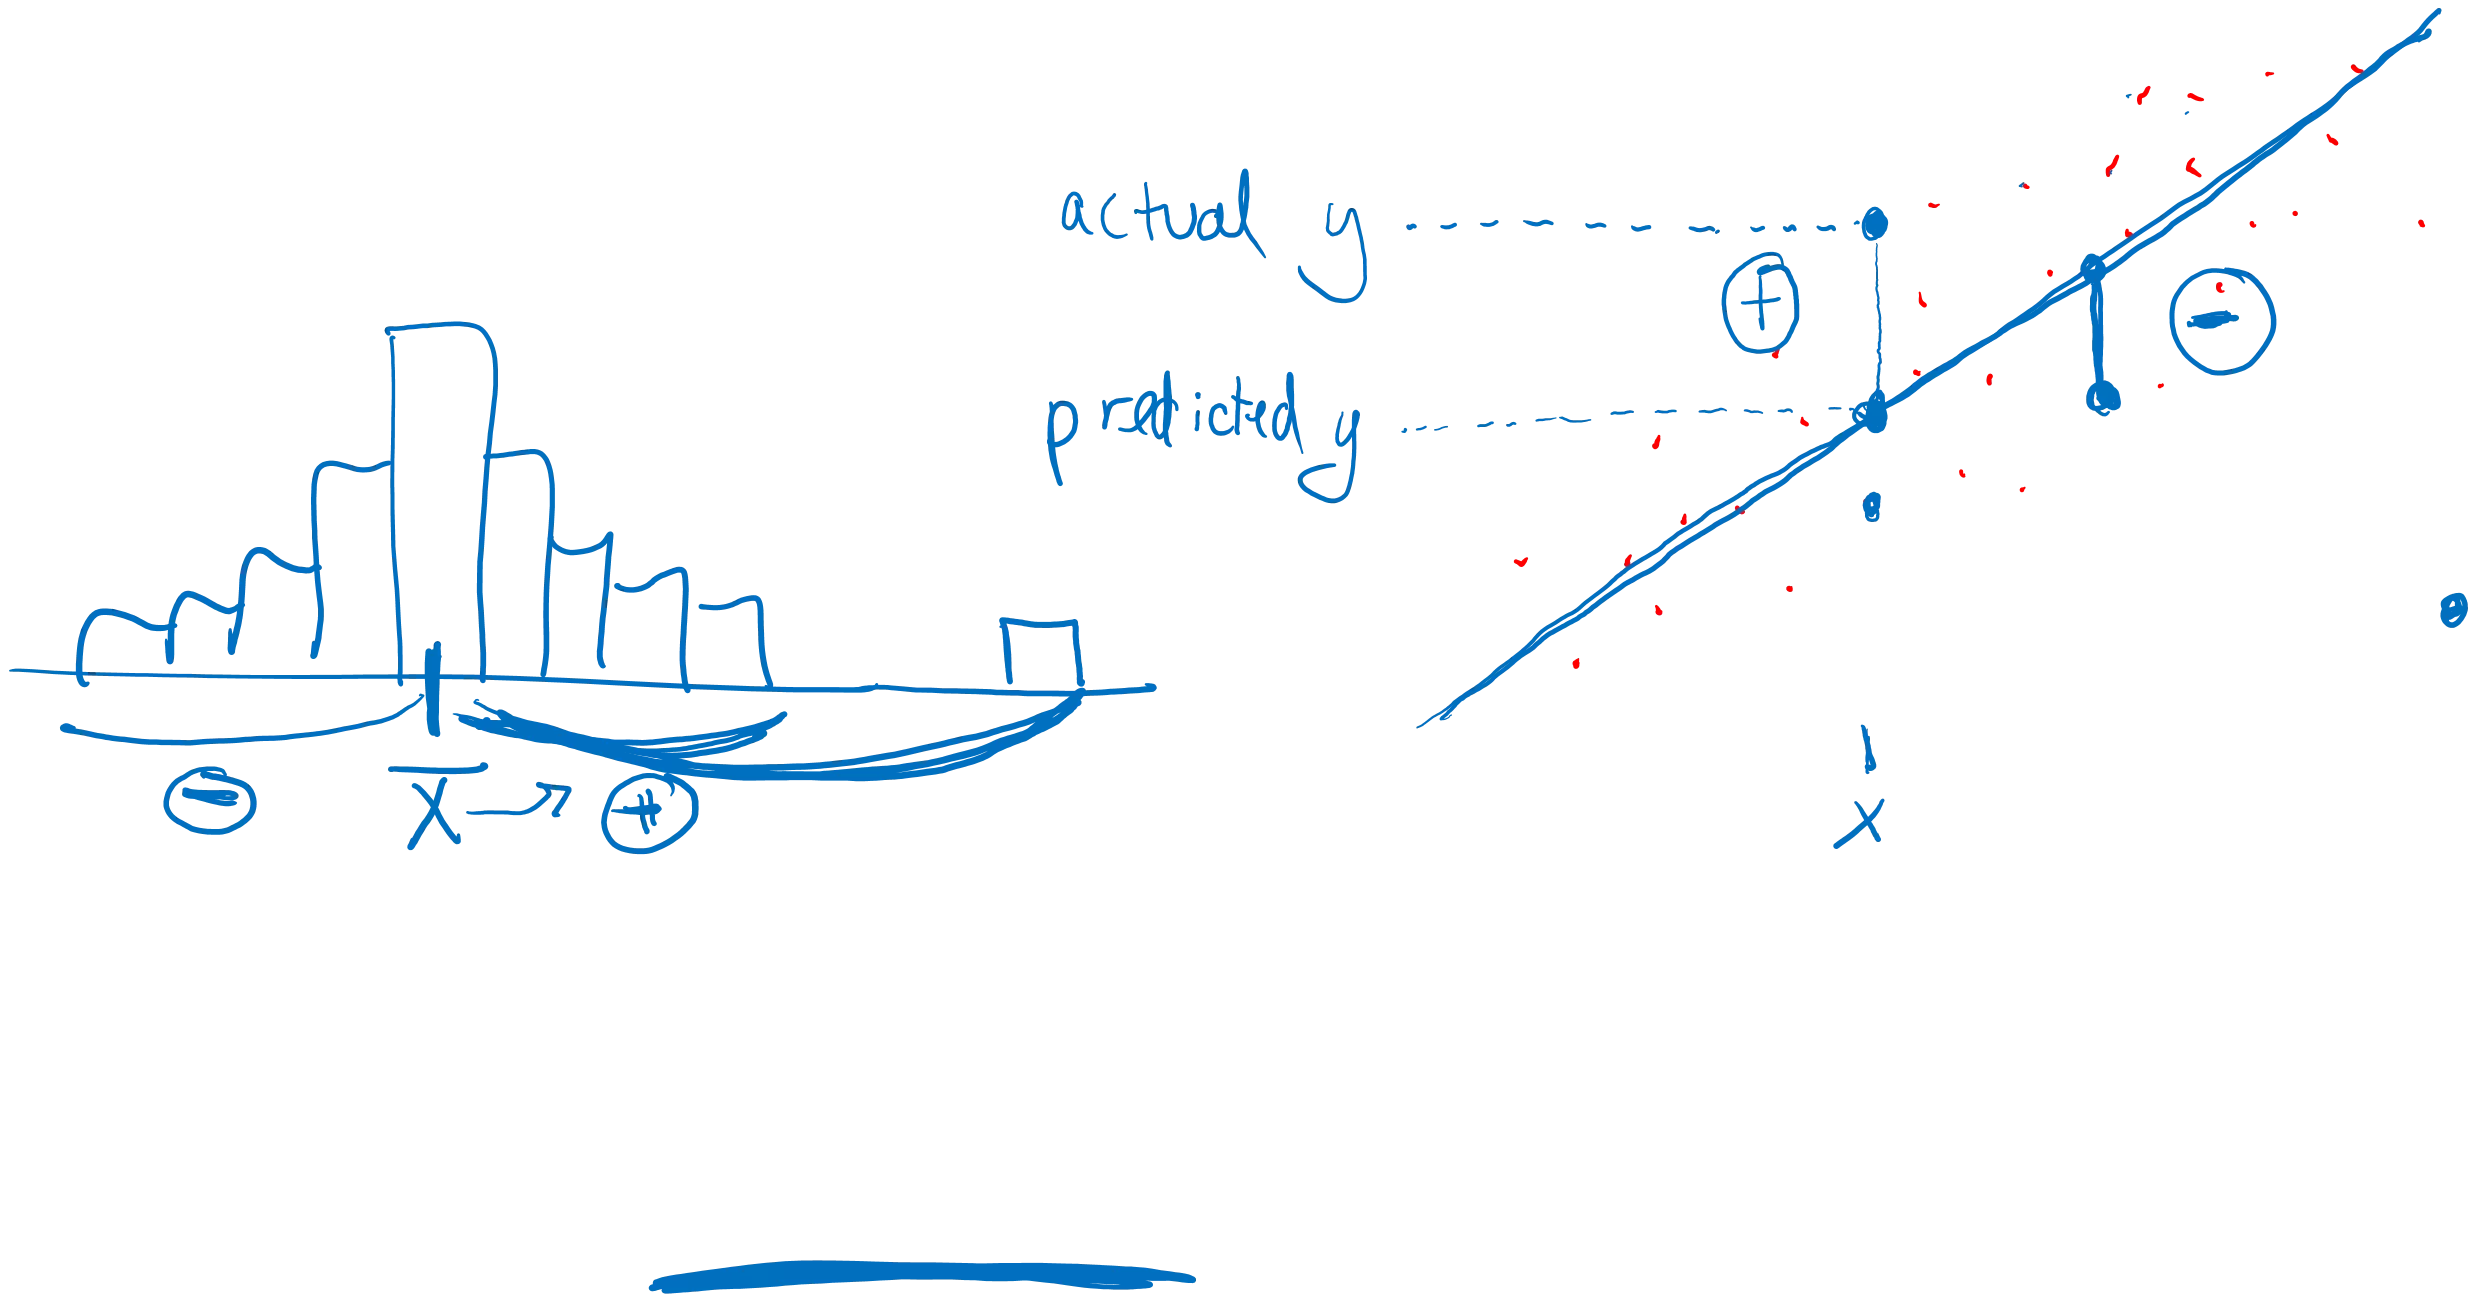
Linear Regression
E
r
r
o
r
s
=
R
E
S
I
D
U
A
L
S
=
a
c
t
u
a
l
Y
v
a
l
u
e
-
p
r
e
d
i
c
t
e
d
Y
v
a
l
u
e
sum of + errors = sum of – errors
line of best fit ~ average (mean) of the plot

Linear Regression Line:
•
Describes how…
a response variable (Y) changes as an explanatory
variable (X) changes
•
Used to …
predict the value of Y for a given value of X

Most accurate Regression line:
•
Called:
Least Squares Regression Line (LSR line or LSRL)
•
Definition: minimizes…
the (errors)
2
of Y
•
Form:
y =
a
+ b(X)
b = SLOPE =
a
= Y-INTERCEPT =
•
always …
passes thru (X, Y)
•
not resistant (to outliers) = outliers affect the line a lot!
Using Summary Stats
Example: We want to analyze the attempts versus the number of touchdowns
1)
Use the AP Formulas to find the line of best fit.
2) Use two points to graph the line of best fit on the plot.
Finding the line on the calculator: (p. 187 in book- TI TIPS)
EXAMPLE:
•
STAT --> CALC --> 8:LinReg(a + bx) XLIST, YLIST, Y1
**note: you get Y1 by going VARS--> YVARS-->FUNCTION -->Y1
Interpreting the slope:
(fill in the underlined things)
For every increase of 1
x-variable (units)
the
y-variable
increases/decreases
by
slope (units)
on average
.
Interpreting the y-intercept:
(fill in the underlined things)
When the
x-variable
is 0
x-units
, the
y-variable
is predicted to be
y-
intercept
y-units
.
Example:
A real estate agent studied the relationship between house prices and
size (square footage). He found the least-squares regression line to be:
Selling Price = 51912.73 + 47.734(Square Feet)
a) Interpret the slope.
b) Interpret the Y-Intercept.
Extrapolation-
using an x-value far outside the range of data given to predict a y-
value. Extrapolation is NOT trustworthy.
Coefficient of determination:
symbol & calculation:
r
2
(listed as a percent)
* r
2
is the overall measure of how successful the regression (LSRL) is in linearly
relating Y to X.
sentence interpretation:
r
2
% of the
change
in the
y-variable
is due to the
change
in the
x-variable
.
OR
r
2
% of the
variability
in the
y-variable
is accounted for by the linear regression on
the
x-variable
.
Example:
A real estate agent studied the relationship between house prices and
size (square footage). He found the least-squares regression line to be:
Selling Price = 51912.73 + 47.734(Square Feet)
r = 0.82
Interpret r
2
Worksheet 8A
Residuals (errors):
Residual = actual y-value - predicted y- value
Σ
residuals =
sum of the residuals = 0
X
residuals
= mean of the residuals = 0
Residual Plot:
Definition: scatterplot of X-variable vs. residuals
EXAMPLES:
ORIGINAL PLOT
RESIDUAL PLOT
LINEAR
CURVED
* Helps...
assess the fit of the LSR line
* No pattern =
scattered = our line is a good model for the data
* Pattern/curve/form =
another model/equation (quadratic, exponential, etc.)
would be a better fit for the data
Note: seeing a form in the residual plot does not mean that the linear model is a bad fit for the
data. It just means it's not the BEST fit, and another non-linear model/equation would fit this
data better.
Examples:
Examples: CAR data
These are lists of weights versus miles per gallon for a sample of cars.
Assessing the fit of the linear model:
IS THE LINEAR MODEL APPROPRIATE FOR THE DATA (BEST FIT)?
YES:
* original plot is linear
* correlation (r) is high/strong
* residual plot is scattered
NO:
* any of the above are not true
(still comment on all 3 things!)
Worksheet 8B and 8C
3 ways to be given data:
1)
Given two lists of data
* use calculator to find LSRL
2)
Given summary stats (r, Sy, Sx, y, x)
* Use AP formulas to find LSRL
3) Computer outputs
Linear Regression Computer Outputs
EXAMPLE 1:
An insurance company conducts a survey of 15 of its life insurance agents. The average number of minutes spent
with each potential customer and the number of policies sold in a week are noted for each agent.
The following is a printout from the statistical analysis tool on Microsoft Excel.
1.
What is the equation of the LSR line relating minutes spent and policies sold.
2. What is the value of
r
? What is the value of
r
2
?
3. Interpret the slope in the context of the problem
For each additional minute an insurance agent spends
with a customer, the number of policies sold increases
by 0.5492 policies, on average
1.
What is the equation of the LSR line relating degree days to gas consumption?
2.
What is the value of
r
? What is the value of
r
2
?
1.
What is the equation of the LSR line?
2.
What is the value of
r
? What is the value of
r
2
?
Linear regression is a fundamental statistical technique used to analyze the relationship between variables. This method involves calculating the line of best fit that minimizes the sum of squared errors to predict the response variable based on an explanatory variable. The least squares regression line (LSRL) is a key concept, aiming to accurately model the data. Through interpreting the slope and y-intercept, one can understand how changes in the explanatory variable impact the response variable. Extrapolation is another aspect, used to predict values outside the data range. Explore these key concepts with examples and learn how to find the regression line on calculators.

Download Presentation

Please find below an Image/Link to download the presentation.
The content on the website is provided AS IS for your information and personal use only. It may not be sold, licensed, or shared on other websites without obtaining consent from the author.If you encounter any issues during the download, it is possible that the publisher has removed the file from their server.
You are allowed to download the files provided on this website for personal or commercial use, subject to the condition that they are used lawfully. All files are the property of their respective owners.
The content on the website is provided AS IS for your information and personal use only. It may not be sold, licensed, or shared on other websites without obtaining consent from the author.
E N D
Presentation Transcript
Ch. 8 Linear Regression Errors = RESIDUALS = actual Y value - predicted Y value sum of + errors = sum of errors line of best fit ~ average (mean) of the plot
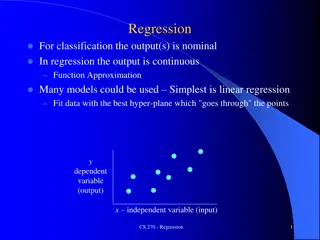
Linear Regression Line: Describes how a response variable (Y) changes as an explanatory variable (X) changes Used to predict the value of Y for a given value of X
Most accurate Regression line: Called: Least Squares Regression Line (LSR line or LSRL) Definition: minimizes the (errors)2 of Y Form: y = a + b(X) b = SLOPE = a = Y-INTERCEPT = always passes thru (X, Y) not resistant (to outliers) = outliers affect the line a lot!
Using Summary Stats Example: We want to analyze the attempts versus the number of touchdowns 1) Use the AP Formulas to find the line of best fit. 2) Use two points to graph the line of best fit on the plot.
Finding the line on the calculator: (p. 187 in book- TI TIPS) EXAMPLE: STAT --> CALC --> 8:LinReg(a + bx) XLIST, YLIST, Y1 **note: you get Y1 by going VARS--> YVARS-->FUNCTION -->Y1
Interpreting the slope:(fill in the underlined things) For every increase of 1 x-variable (units) the y-variable increases/decreases by slope (units) on average. Interpreting the y-intercept:(fill in the underlined things) When the x-variable is 0 x-units, the y-variable is predicted to be y- intercept y-units.
Example: A real estate agent studied the relationship between house prices and size (square footage). He found the least-squares regression line to be: Selling Price = 51912.73 + 47.734(Square Feet) a) b) Interpret the slope. Interpret the Y-Intercept.
Extrapolation- using an x-value far outside the range of data given to predict a y- value. Extrapolation is NOT trustworthy.
Coefficient of determination: symbol & calculation: r2 (listed as a percent) * r2 is the overall measure of how successful the regression (LSRL) is in linearly relating Y to X. sentence interpretation: r2 % of the change in the y-variable is due to the change in the x-variable. OR r2 % of the variability in the y-variable is accounted for by the linear regression on the x-variable.
Example: A real estate agent studied the relationship between house prices and size (square footage). He found the least-squares regression line to be: Selling Price = 51912.73 + 47.734(Square Feet) Interpret r2 r = 0.82
Residuals (errors): Residual = actual y-value - predicted y- value residuals = sum of the residuals = 0 Xresiduals = mean of the residuals = 0
Residual Plot: Definition: scatterplot of X-variable vs. residuals EXAMPLES: ORIGINAL PLOT LINEAR RESIDUAL PLOT CURVED
* Helps... assess the fit of the LSR line * No pattern = scattered = our line is a good model for the data * Pattern/curve/form = another model/equation (quadratic, exponential, etc.) would be a better fit for the data Note: seeing a form in the residual plot does not mean that the linear model is a bad fit for the data. It just means it's not the BEST fit, and another non-linear model/equation would fit this data better. Examples:
Examples: CAR data These are lists of weights versus miles per gallon for a sample of cars.
Assessing the fit of the linear model: IS THE LINEAR MODEL APPROPRIATE FOR THE DATA (BEST FIT)? YES: * original plot is linear * correlation (r) is high/strong * residual plot is scattered NO: * any of the above are not true (still comment on all 3 things!)
3 ways to be given data: 1) Given two lists of data * use calculator to find LSRL 2) Given summary stats (r, Sy, Sx, y, x) * Use AP formulas to find LSRL 3) Computer outputs
Linear Regression Computer Outputs EXAMPLE 1: An insurance company conducts a survey of 15 of its life insurance agents. The average number of minutes spent with each potential customer and the number of policies sold in a week are noted for each agent. The following is a printout from the statistical analysis tool on Microsoft Excel.
1. What is the equation of the LSR line relating minutes spent and policies sold. 2. What is the value of r? What is the value of r2? 3. Interpret the slope in the context of the problem For each additional minute an insurance agent spends with a customer, the number of policies sold increases by 0.5492 policies, on average
1. What is the equation of the LSR line relating degree days to gas consumption? 2. What is the value of r? What is the value of r2?
1. What is the equation of the LSR line? 2. What is the value of r? What is the value of r2?


")


:")