Linear Regression Analysis in Statistics
Introductory Statistics
MA207
Day 38 - Linear Regression
Fun with correlation
Go to
THIS WEB SITE
and find your favorite correlation.
To find more correlations,
Scroll to the bottom of the page
Click “Discover a correlation”
Pick your “interesting variable”
Click “View Variables”
Select your variable and click “Correlate”
Select your favorite and create the chart
What is the takeaway from this exercise?
Regression Example
Download the Used Honda Civic data from Moodle.
Create a scatter plot of the data
Do you see a relationship between the age of the car and its price? How would
you describe that relationship?
Regression Example
Download the Used Honda Civic data from Moodle.
Create a scatter plot of the data
Do you see a relationship between the age of the car and its price? How would
you describe that relationship?
For each extra year of age, the car prices goes
up/down
by _
$
___________.
Put your
best guess
in Nearpod
Linear Regression
Regression Example
Using the Used Honda Civic data from Moodle.
Create a scatter plot of the data
Find the correlation coefficient, slope, and intercept using
=CORREL( )
=SLOPE( )
=INTERCEPT( )
In the plot, right click on the data and select “Add Trendline”, display the
equation, and display the R
2
.
Using our Used Honda Civic regression
With the Used Honda Civic data:
1.
Is the relationship between age and price positive or negative. Give two ways
that you know this.
2.
Assume that we have an 8 year old Honda Civic. According to our linear
regression, what is the approximate price if we were to sell it?
(nearpod)
3.
According to our linear regression, what is the approximate price of an 18
year old Honda Civic?
4.
If a used car dealer sold a Honda Civic for $10,000, what was the
approximate age of the car according to our linear regression?
5.
What percent of the variation in price is explained by the age of the Honda
Civic?
Using our Used Honda Civic regression
With the Used Honda Civic data:
1.
Is the relationship between age and price positive or negative. Give two ways
that you know this.
2.
Assume that we have an 8 year old Honda Civic. According to our linear
regression, what is the approximate price if we were to sell it?
3.
According to our linear regression, what is the approximate price of an 18
year old Honda Civic?
(nearpod)
4.
If a used car dealer sold a Honda Civic for $10,000, what was the
approximate age of the car according to our linear regression?
5.
What percent of the variation in price is explained by the age of the Honda
Civic?
Using our Used Honda Civic regression
With the Used Honda Civic data:
1.
Is the relationship between age and price positive or negative. Give two ways
that you know this.
2.
Assume that we have an 8 year old Honda Civic. According to our linear
regression, what is the approximate price if we were to sell it?
3.
According to our linear regression, what is the approximate price of an 18
year old Honda Civic?
4.
If a used car dealer sold a Honda Civic for $10,000, what was the
approximate age of the car according to our linear regression?
(nearpod)
5.
What percent of the variation in price is explained by the age of the Honda
Civic?
Is there a relationship between GPA and # of missed classes?
A high school athletic director is worried that his athletes are missing too much
class. In particular, he is curious if there is a relationship between the GPA of his
student athletes and the number of classes missed during a semester for sports-
related reasons.
Create a linear regression model for this data.
•
Classify the relationship as
strong / weak,
positive / negative,
linear / nonlinear
•
How much variation in GPA is explained by the number of days missed?
•
What is the expected GPA for a student who misses 3 days for sports?
•
What is the expected GPA for a student who misses 7 days for sports?
Regression Example
Open the fish data set from Lab 7 Part 2.
Is there a linear relationship between length and weight of fish? Let x = length and
y = weight.
How strong is that relationship? (Describe this in words and numbers)
Your boss at Fish and Game wants to know whether you can use your trend line
to predict the weight of a fish that is 900 mm in length. What would you say?
Outliers and Regression
Use THIS APPLET (https://www.geogebra.org/m/MZMBYx2p) to help answer the
following questions.
If you have a strong positive correlation, how can one outlier influence the
correlation coefficient?
Can an outlier switch a correlation from positive to negative?
What do you do when you spot an outlier in your data set?
Explore the fundamentals of linear regression for statistical analysis. Understand how to interpret regression results and make predictions. Learn key concepts, tools, and applications in this essential statistical technique.

Uploaded on Mar 08, 2025 | 0 Views
Download Presentation

Please find below an Image/Link to download the presentation.
The content on the website is provided AS IS for your information and personal use only. It may not be sold, licensed, or shared on other websites without obtaining consent from the author.If you encounter any issues during the download, it is possible that the publisher has removed the file from their server.
You are allowed to download the files provided on this website for personal or commercial use, subject to the condition that they are used lawfully. All files are the property of their respective owners.
The content on the website is provided AS IS for your information and personal use only. It may not be sold, licensed, or shared on other websites without obtaining consent from the author.
E N D
Presentation Transcript
Introductory Statistics MA207 Day 38 - Linear Regression
Fun with correlation Go to THIS WEB SITE and find your favorite correlation. To find more correlations, Scroll to the bottom of the page Click Discover a correlation Pick your interesting variable Click View Variables Select your variable and click Correlate Select your favorite and create the chart What is the takeaway from this exercise?
Regression Example Download the Used Honda Civic data from Moodle. Create a scatter plot of the data Do you see a relationship between the age of the car and its price? How would you describe that relationship?
Regression Example Download the Used Honda Civic data from Moodle. Create a scatter plot of the data Do you see a relationship between the age of the car and its price? How would you describe that relationship? For each extra year of age, the car prices goes up/down by _$___________. Put your best guess in Nearpod
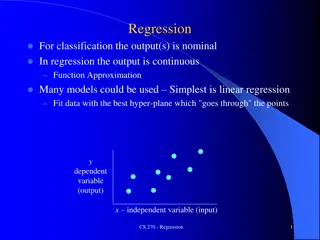
Linear Regression To relate two variables where one variable is presumed to depend on another we often find a best fit line of the form ? = ?? + ? Allows for interpolation and extrapolation One of the most used (and abused!) statistical tools The point ( ?, ?) is always on the best fit line. Recall that ? is the average of the x values and ? is the average of the y values The slope of the line is built from the standard deviations in the x and y directions Correlation Coefficient R = -1: Perfect fit with negative slope R = 1: Perfect fit with positive slope R = 0: No linear fit Squared Correlation Coefficient: R2 The percent of the variation in y explained by x
Regression Example Using the Used Honda Civic data from Moodle. Create a scatter plot of the data Find the correlation coefficient, slope, and intercept using =CORREL( ) =SLOPE( ) =INTERCEPT( ) In the plot, right click on the data and select Add Trendline , display the equation, and display the R2.
Using our Used Honda Civic regression With the Used Honda Civic data: 1.Is the relationship between age and price positive or negative. Give two ways that you know this. 2.Assume that we have an 8 year old Honda Civic. According to our linear regression, what is the approximate price if we were to sell it? (nearpod) 3.According to our linear regression, what is the approximate price of an 18 year old Honda Civic? 4.If a used car dealer sold a Honda Civic for $10,000, what was the approximate age of the car according to our linear regression? 5.What percent of the variation in price is explained by the age of the Honda Civic?
Using our Used Honda Civic regression With the Used Honda Civic data: 1.Is the relationship between age and price positive or negative. Give two ways that you know this. 2.Assume that we have an 8 year old Honda Civic. According to our linear regression, what is the approximate price if we were to sell it? 3.According to our linear regression, what is the approximate price of an 18 year old Honda Civic? (nearpod) 4.If a used car dealer sold a Honda Civic for $10,000, what was the approximate age of the car according to our linear regression? 5.What percent of the variation in price is explained by the age of the Honda Civic?
Using our Used Honda Civic regression With the Used Honda Civic data: 1.Is the relationship between age and price positive or negative. Give two ways that you know this. 2.Assume that we have an 8 year old Honda Civic. According to our linear regression, what is the approximate price if we were to sell it? 3.According to our linear regression, what is the approximate price of an 18 year old Honda Civic? 4.If a used car dealer sold a Honda Civic for $10,000, what was the approximate age of the car according to our linear regression? (nearpod) 5.What percent of the variation in price is explained by the age of the Honda Civic?
Is there a relationship between GPA and # of missed classes? A high school athletic director is worried that his athletes are missing too much class. In particular, he is curious if there is a relationship between the GPA of his student athletes and the number of classes missed during a semester for sports- related reasons. Create a linear regression model for this data. Classify the relationship as strong / weak, positive / negative, linear / nonlinear How much variation in GPA is explained by the number of days missed? What is the expected GPA for a student who misses 3 days for sports? What is the expected GPA for a student who misses 7 days for sports?
Is there a relationship between GPA and # of missed classes? A high school athletic director is worried that his athletes are missing too much class. In particular, he is curious if there is a relationship between the GPA of his student athletes and the number of classes missed during a semester for sports- related reasons. Create a linear regression model for this data. Classify the relationship as strong / weak, positive / negative, linear / nonlinear How much variation in GPA is explained by the number of days missed? What is the expected GPA for a student who misses 3 days for sports? What is the expected GPA for a student who misses 7 days for sports?
Is there a relationship between GPA and # of missed classes? A high school athletic director is worried that his athletes are missing too much class. In particular, he is curious if there is a relationship between the GPA of his student athletes and the number of classes missed during a semester for sports- related reasons. Create a linear regression model for this data. Classify the relationship as strong / weak, positive / negative, linear / nonlinear How much variation in GPA is explained by the number of days missed? What is the expected GPA for a student who misses 3 days for sports? What is the expected GPA for a student who misses 7 days for sports?
Regression Example Open the fish data set from Lab 7 Part 2. Is there a linear relationship between length and weight of fish? Let x = length and y = weight. How strong is that relationship? (Describe this in words and numbers) Your boss at Fish and Game wants to know whether you can use your trend line to predict the weight of a fish that is 900 mm in length. What would you say?
Outliers and Regression Use THIS APPLET (https://www.geogebra.org/m/MZMBYx2p) to help answer the following questions. If you have a strong positive correlation, how can one outlier influence the correlation coefficient? Can an outlier switch a correlation from positive to negative? What do you do when you spot an outlier in your data set?