Insights on Snow Sublimation in Winter 2022-2023: Measurements and Modeling
Explore the sublimation of snow during the winter of 2022-2023 through measurements from the SoS campaign. The research delves into sublimation during blowing and non-blowing snow conditions, comparing estimates from different methods, and modeling seasonal cumulative sublimation. Collaboration ideas with SAIL and SPLASH campaigns are also discussed.
Uploaded on Sep 06, 2024 | 2 Views
Download Presentation

Please find below an Image/Link to download the presentation.
The content on the website is provided AS IS for your information and personal use only. It may not be sold, licensed, or shared on other websites without obtaining consent from the author.If you encounter any issues during the download, it is possible that the publisher has removed the file from their server.
You are allowed to download the files provided on this website for personal or commercial use, subject to the condition that they are used lawfully. All files are the property of their respective owners.
The content on the website is provided AS IS for your information and personal use only. It may not be sold, licensed, or shared on other websites without obtaining consent from the author.
E N D
Presentation Transcript
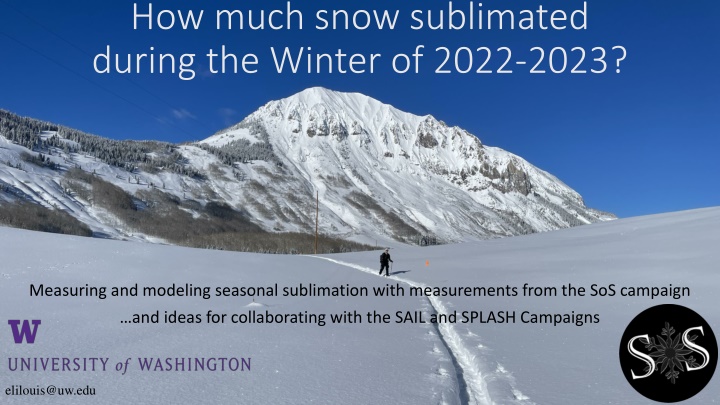
How much snow sublimated during the Winter of 2022-2023? Measuring and modeling seasonal sublimation with measurements from the SoS campaign and ideas for collaborating with the SAIL and SPLASH Campaigns elilouis@uw.edu 1
Research Questions 1. How much sublimation did we measure at Kettle Ponds over the 2022-23 snow season? How much sublimation occurs during blowing snow and non-blowing snow conditions? 2. How do estimates by the eddy covariance measurements and mean-profile (MOST/bulk aerodynamic) methods compare? elilouis@uw.edu 2
Measuring seasonal cumulative sublimation ~3 5% of winter precipitation (702mm) (5-8% of seasonal max SWE, 437mm) EC Seasonal cumulative sublimation (mm SWE) elilouis@uw.edu 3
Measuring seasonal cumulative sublimation ~3 5% of winter precipitation (702mm) (5-8% of seasonal max SWE, 437mm) Sublimation during blowing snow Daily sublimation (mm SWE) Blowing Snow EC accounted for ~43% of moisture lost FlowCapt blowing snow sensor Seasonal cumulative sublimation (mm SWE) elilouis@uw.edu 4
Measuring seasonal cumulative sublimation ~3 5% of winter precipitation (702mm) (5-8% of seasonal max SWE, 437mm) Sublimation during blowing snow Daily sublimation (mm SWE) Blowing Snow EC accounted for ~43% of moisture lost FlowCapt blowing snow sensor Seasonal cumulative sublimation (mm SWE) elilouis@uw.edu 5
Modeling seasonal cumulative sublimation Use offline turbulence method (Monin Obukhov Similarity Theory) to run model ensemble (n=240) (Lapo, 2018) Many different stability functions Range of z0, 1e-5 to 1e-3 Multiple surface temperature measurements Models estimate between 5 21% of winter precipitation (702mm) max model run 149mm MOST Ensemble Min model run 33.7mm SOS EC measurements elilouis@uw.edu 6
Modeling seasonal cumulative sublimation Use offline turbulence method (Monin Obukhov Similarity Theory) to run model ensemble (n=240) (Lapo, 2018) Many different stability functions Range of z0, 1e-5 to 1e-3 Multiple surface temperature measurements Models estimate between 5 21% of winter precipitation (702mm) Models very sensitive to z0, insensitive to stability function Models sensitive to Ts max model run 149mm MOST Ensemble Min model run 33.7mm SOS EC measurements elilouis@uw.edu 7
Modeling seasonal cumulative sublimation Focus on 2 model runs that (relatively) closely match measurements, varying only by surface temperature measurement used (Pyrgeometer vs LW Radiometer) Seasonal cumulative sublimation estimated by 2 model runs, varying only by the input Ts measurement LW radiometer Pyrgeometer SOS Measured 8
Modeling seasonal cumulative sublimation Focus on 2 model runs that (relatively) closely match measurements, varying only by surface temperature measurement used (Pyrgeometer vs LW Radiometer) Seasonal cumulative sublimation estimated by 2 model runs, varying only by the input Ts measurement LW radiometer Pyrgeometer SOS Measured 9
Modeling seasonal cumulative sublimation Focus on 2 model runs that (relatively) closely match measurements, varying only by surface temperature measurement used (Pyrgeometer vs LW Radiometer) Seasonal cumulative sublimation estimated by 2 model runs, varying only by the input Ts measurement LW radiometer Pyrgeometer Saturation vapor pressure curve MOST states that sublimation vapor pressure gradient, which depends on the saturated vapor pressure at the snow surface, a function of Ts ??,0 (??) SOS Measured ?????? ??? ???? ?? ( ?) 10
Modeling seasonal cumulative sublimation We observed frequent disagreement between temperatures calculated using the pyrgeometer and the downward-facing LW radiometer And small differences in surface temperature result in significant differences in near-surface vapor pressure gradient Nighttime vapor pressure profile based on two measures of Ts Surface temp. (Ts) measurements, Feb. 1-2, 2023 LW radiometer Pyrgeometer elilouis@uw.edu 11
Modeling seasonal cumulative sublimation This is what the difference in choice of Ts measurement looks like on a single day Switching gears slightly Modeled and measured latent heat flux, January 19, 2023 Model run using Pyrgeometer Model run using LW radiometer SOS Measured 12
Differences in turbulence measurements across sites/campaigns are of similar order of magnitude as differences in modeled sublimation due to different Ts measurements Different amounts of noise in measurements indicate that cleaning/preprocessing methods influence calculated turbulent fluxes Modeling seasonal cumulative sublimation This is what the difference in choice of Ts measurement looks like on a single day Switching gears slightly Measured latent heat flux as multiple sites, January 19, 2023 Modeled and measured latent heat flux, January 19, 2023 Model run using Pyrgeometer Model run using LW radiometer SOS Measured 13
Measuring seasonal cumulative sublimation again MOST Ensemble SAIL turbulent flux measurements result in very close sublimation estimates despite being ~2km away SAIL ECOR, Gothic SAIL ECOR, Kettle Ponds More variability in turb. flux measurements that are all at the same site SOS, Kettle Ponds elilouis@uw.edu 14
Stossel box Stossel box Daily sublimation measured two ways Daily sublimation measured two ways Incorporating SAIL and SPLASH measurements Eddy Covariance Stossel box/ lysimeter Vertical profiles of Latent heat Vertical profiles of Latent heat flux, Kettle Ponds flux, Kettle Ponds Winter (Feb 2) Moving forward: Calculate z0 for the study sites, identify the best MOST model runs Explore hypothesis that EC measurements under-measure surface fluxes Why does MOST almost always overestimates sublimation? Could lateral advection of moisture mean that EC measurements to not represent the surface flux? Ideas for collaboration: Compile all raw turbulent flux measurements, apply same processing/cleaning steps Use MEP model to calculate sublimation Compile all Ts measurements, explore novel methods for estimating Ts Examine land surface model runs, compare estimated and measured Ts 12pm Spring (Mar 30) 12pm elilouis@uw.edu 15
References Abatzoglou, J. T., Rallings, A., Bernacchi, L., Viers, J. & Medell n-Azuara, J. California s Missing Forecast Flows in Spring 2021 Challenges for seasonal flow forecasting. California WaterBlog https://californiawaterblog.com/2021/07/18/californias-missing-forecast-flows-in-spring-2021- challenges-for-seasonal-flow-forecasting/ (2021). Alduchov, O. A. & Eskridge, R. E. Improved Magnus form approximation of saturation vapor pressure. J. Appl. Meteorol. 35, 601 609 (1996). Bolton, D., 1980: The computation of equivalent potential temperature. Mon. Wea. Rev., 108. Lapo, K. E. (2018). Turbpy Python package for simulating turbulence. Seattle, WA: University of Washington. https://doi.org/10.5281/ zenodo.1421061 elilouis@uw.edu 16
