Initial Looks at ADNI3 and Analysis Update - Biostatistics Core Goals and New Measurement
This update discusses the goals of the Biostatistics Core in integrating data from various sources for clinical trial design, assessing biomarkers and clinical measures, and identifying subgroups in MCI. The update also introduces a new measurement, the Financial Capacity Instrument, and shares preliminary results showing expected patterns across different diagnostic groups.
Download Presentation

Please find below an Image/Link to download the presentation.
The content on the website is provided AS IS for your information and personal use only. It may not be sold, licensed, or shared on other websites without obtaining consent from the author.If you encounter any issues during the download, it is possible that the publisher has removed the file from their server.
You are allowed to download the files provided on this website for personal or commercial use, subject to the condition that they are used lawfully. All files are the property of their respective owners.
The content on the website is provided AS IS for your information and personal use only. It may not be sold, licensed, or shared on other websites without obtaining consent from the author.
E N D
Presentation Transcript
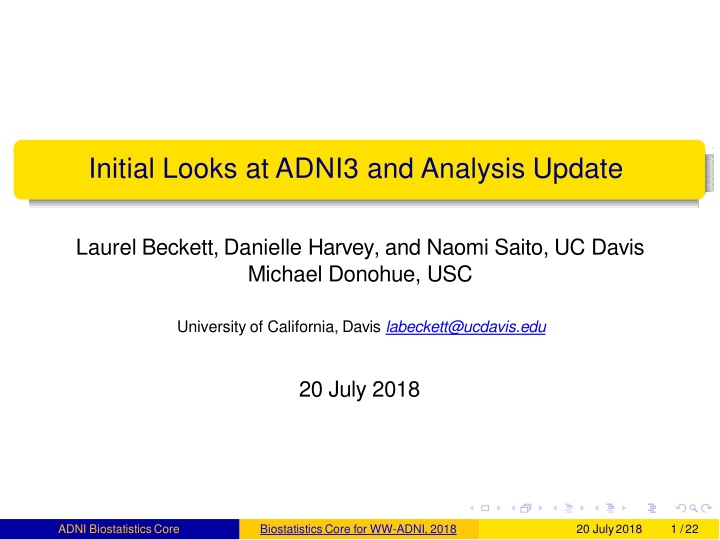
Initial Looks at ADNI3 and Analysis Update Laurel Beckett, Danielle Harvey, and Naomi Saito, UC Davis Michael Donohue, USC University of California, Davis labeckett@ucdavis.edu 20 July 2018 ADNI BiostatisticsCore Biostatistics Core for WW-ADNI, 2018 20 July2018 1 /22
Disclosures Work presented here was funded in part by: U19AG024904 (Weiner) - ADNI parent grant P30AG010129 (DeCarli) - UC Davis Alzheimer s Disease Center ADNI BiostatisticsCore Biostatistics Core for WW-ADNI, 2018 20 July2018 2 /22
Biostatistics Core goals: Integrate data from all Cores to study implications for clinical trial design: Compare candidate biomarkers and clinical measures for potential at baseline for inclusion/ exclusion, stratification, adjustment. Compare candidate biomarkers and clinical measures for potential as outcome measures of change in clinical trials. Assess relationship of changes among biomarkers and clinical measures. Characterize sequence of changes, especially in preclinical and early stages. Identify important subgroups in MCI. ADNI BiostatisticsCore Biostatistics Core for WW-ADNI, 2018 20 July2018 3 /22
Whats new from the Biostatistics Core ADNI3 is still mostly cross-sectional data, so we can t look at prognosis yet. Looking at new measures: e.g. Financial Capacity Instrument. Multiple amyloid measures: how do they compare? Continuing to wrap up analysis of earlier ADNI phases. ADNI BiostatisticsCore Biostatistics Core for WW-ADNI, 2018 20 July2018 4 /22
A new measurement: Financial Capacity Instrument Financial Capacity Instrument (FCI), 37 items, covering 5 domains: Mental calculation (2 items) Financial conceptual knowledge (4 items) Single checkbook/ register task (10 items) Multiple checkbook/ register task (14 items) Bank statement task (7 items) We have taken a preliminary look at the FCI on the first 384 participants (245 CN, 114 MCI, 25 AD). ADNI BiostatisticsCore Biostatistics Core for WW-ADNI, 2018 20 July2018 5 /22
FCI results: Total score by diagnosis group Shows expected pattern with AD much worse. MCI appears closer to NC. ADNI BiostatisticsCore Biostatistics Core for WW-ADNI, 2018 20 July2018 6 /22
Are MCI closer to AD than to NC in somedomains than others? We did ANOVA, then scaled all distances from NC to AD as 1.0. Domain NC to MCI Mental calc 0.25 Financial knowledge 0.29 Single checkbook 0.28 Multiple checkbook 0.25 Bank Statement 0.31 MCI to AD 0.75 0.71 0.72 0.75 0.69 Overall, MCI scores are about 25-30% of the way to the AD group. ADNI BiostatisticsCore Biostatistics Core for WW-ADNI, 2018 20 July2018 7 /22
Timed performance on financial tasks MCI about 56% of the way toward the AD group on time. They can still do some tasks but slower. ADNI BiostatisticsCore Biostatistics Core for WW-ADNI, 2018 20 July2018 8 /22
Ranking of performance across domains: Mallows model A first look at whether individuals vary in which domains have more problems. We converted each domain score to a percent of maximum possible. We ranked the percent scores within each individual from best to worst (ties scored as mean of possible ranks.) We fitted a simple Mallows model to estimate most common ranking and how commonly variations occurred. ADNI BiostatisticsCore Biostatistics Core for WW-ADNI, 2018 20 July2018 9 /22
Percent of maximum score by domain The overall picture looks pretty similar across domains! Looking at rankings within individual may tell us more. ADNI BiostatisticsCore Biostatistics Core for WW-ADNI, 2018 20 July2018 10 /22
Basic Mallows model results for FCI (very preliminary!) The most common sequence, best performance to worst, was: Mental calculation Financial conceptual knowledge Single checkbook/ register task Bank statement task Multiple checkbook/ register task Every pairwise adjacent switch dropped the proportion of participants with that ranking about 25%. ADNI BiostatisticsCore Biostatistics Core for WW-ADNI, 2018 20 July2018 11 /22
Amyloid measures: AlzBio3, Roche, Florbetapir We are interested in the relationship among current measures of amyloid status: AlzBio3: immunoassay of CSF amyloid 1 42, U Penn Elecsys: Immunoassay of CSF amyloid 1 42, Roche Florbetapir: [18F]florbetapir PET uptake summary measure. Some longitudinal data are just becoming available, but we focus here on cross-sectional. ADNI BiostatisticsCore Biostatistics Core for WW-ADNI, 2018 20 July2018 12 /22
Data analysis: Roche and Florbetapir values were first log-transformed. We switched the direction of Florbetapir measure so that all 3 would have lower values corresponding to worse. All 3 measures were normalized after this to have mean 0, standard deviation 1. ADNI BiostatisticsCore Biostatistics Core for WW-ADNI, 2018 20 July2018 13 /22
Clinical diagnosis group differences (cross-sectional) All 3 measures have a few AD with normal amyloid. Florbetapir has a few CN with bad amyloid. ADNI BiostatisticsCore Biostatistics Core for WW-ADNI, 2018 20 July2018 14 /22
CSF measure relationship (cross-sectional) Original cutpoints transformed to 0-1 scale. ADNI BiostatisticsCore Biostatistics Core for WW-ADNI, 2018 20 July2018 15 /22
CSF - PET imaging relationship (cross-sectional) Cutpoints again transformed to 0-1 scale. Maybe nonlinear? ADNI BiostatisticsCore Biostatistics Core for WW-ADNI, 2018 20 July2018 16 /22
Other activities: finishing analyses of ADNI2 data Example: Added value" of baseline imaging and fluid biomarkers to predicting cognitive decline just with baseline cognitive and clinical measures in MCI. Results similar to ADNI1. FDG PET adds substantial value to predict greatest rates of decline. New: AV45 amyloid PET adds comparable predictive value. CSF biomarkers add value, not quite as much as PET. Volumetric predictors add minimal value. ADNI BiostatisticsCore Biostatistics Core for WW-ADNI, 2018 20 July2018 17 /22
Other activities: Collaborations Joint work with Takeshi Iwatsubo and Japan-ADNI, comparison with ADNI: to appear in Alzheimer s and Dementia. Collaboration with John Morris and DIAN team: comparison of DIAN disease onset and progression with ADNI. Selection of ADNI participants for comparison study Alignment of time scales to allow comparison despite 30+ year age difference. More from John Morris a little later. ADNI BiostatisticsCore Biostatistics Core for WW-ADNI, 2018 20 July2018 18 /22
Other activities: ATRI biostatistics team Submitted ADNI3 predictions to the tadpole.grand-challenge.org Manuscript in preparation joint mixed effect models + random forests Submitted to Alzheimer s and Dementia: Diagnosis, Assessment and Disease Monitoring pi4cs.org/qt-pad-challenge modeling challenge Risk Based Monitoring tool development ADNI BiostatisticsCore Biostatistics Core for WW-ADNI, 2018 20 July2018 19 /22
ADNI3 updates to Biostatistics Core website The Core interacts with many biostatisticians and other quantitative researchers from academia and industry who are interested in using ADNI data. We have developed updates to our portion of the website to help investigators navigate the database, cope with changes in data acquisition, and work with data files. Sections include: Frequently used ADNI data tables, Common issues working with ADNI tables, Installing ADNIMERGE packages, Biostatistics Core news. ADNI BiostatisticsCore Biostatistics Core for WW-ADNI, 2018 20 July2018 20 /22
Contributors and Collaborators Thank you to our many students and collaborators! Jingxuan Yang, graduate student, Biostatistics. Mike Donohue, PhD (USC); Danielle Harvey, PhD, Naomi Saito, MS, and Yueju Li, MS (UC Davis): the ADNI Biostatistics Core team Mike Weiner and all the ADNI investigators and participants ADNI BiostatisticsCore Biostatistics Core for WW-ADNI, 2018 20 July2018 21 /22
More adventures to come! Thank you! Questions? ADNI BiostatisticsCore Biostatistics Core for WW-ADNI, 2018 20 July2018 22 /22
