Hepatitis B Virus Infection Deaths Data by State 2016-2020
Explore the numbers and rates of deaths related to Hepatitis B virus infection by state in the United States from 2016 to 2020. This detailed table provides insight into the impact of Hepatitis B on residents across various states and jurisdictions, with age-adjusted rates per 100,000 population. Data source: CDC WONDER.

Download Presentation

Please find below an Image/Link to download the presentation.
The content on the website is provided AS IS for your information and personal use only. It may not be sold, licensed, or shared on other websites without obtaining consent from the author. If you encounter any issues during the download, it is possible that the publisher has removed the file from their server.
You are allowed to download the files provided on this website for personal or commercial use, subject to the condition that they are used lawfully. All files are the property of their respective owners.
The content on the website is provided AS IS for your information and personal use only. It may not be sold, licensed, or shared on other websites without obtaining consent from the author.
E N D
Presentation Transcript
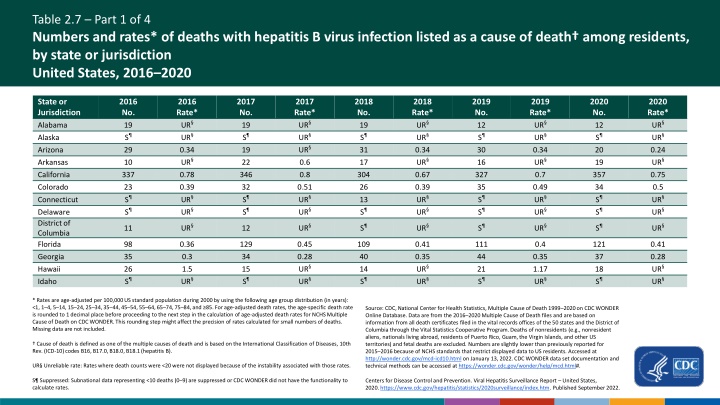
Table 2.7 Part 1 of 4 Numbers and rates* of deaths with hepatitis B virus infection listed as a cause of death among residents, by state or jurisdiction United States, 2016 2020 State or Jurisdiction Alabama 2016 No. 19 S 29 2016 Rate* UR UR 0.34 UR 2017 No. 19 S 19 2017 Rate* UR UR UR 2018 No. 19 S 31 2018 Rate* UR UR 0.34 UR 2019 No. 12 S 30 2019 Rate* UR UR 0.34 UR 2020 No. 12 S 20 2020 Rate* UR UR 0.24 UR Alaska Arizona Arkansas 10 22 0.6 17 16 19 California 337 0.78 346 0.8 304 0.67 327 0.7 357 0.75 Colorado 23 S S 0.39 UR UR 32 S S 0.51 UR UR 26 0.39 UR UR 35 S S 0.49 UR UR 34 S S 0.5 UR UR Connecticut Delaware District of Columbia Florida Georgia Hawaii Idaho 13 S UR UR S UR S UR S UR 11 12 98 35 26 S 0.36 0.3 1.5 UR 129 34 15 S 0.45 0.28 UR UR 109 40 14 S 0.41 0.35 UR UR 111 44 21 S 0.4 0.35 1.17 UR 121 37 18 S 0.41 0.28 UR UR * Rates are age-adjusted per 100,000 US standard population during 2000 by using the following age group distribution (in years): <1, 1 4, 5 14, 15 24, 25 34, 35 44, 45 54, 55 64, 65 74, 75 84, and 85. For age-adjusted death rates, the age-specific death rate is rounded to 1 decimal place before proceeding to the next step in the calculation of age-adjusted death rates for NCHS Multiple Cause of Death on CDC WONDER. This rounding step might affect the precision of rates calculated for small numbers of deaths. Missing data are not included. Source: CDC, National Center for Health Statistics, Multiple Cause of Death 1999 2020 on CDC WONDER Online Database. Data are from the 2016 2020 Multiple Cause of Death files and are based on information from all death certificates filed in the vital records offices of the 50 states and the District of Columbia through the Vital Statistics Cooperative Program. Deaths of nonresidents (e.g., nonresident aliens, nationals living abroad, residents of Puerto Rico, Guam, the Virgin Islands, and other US territories) and fetal deaths are excluded. Numbers are slightly lower than previously reported for 2015 2016 because of NCHS standards that restrict displayed data to US residents. Accessed at http://wonder.cdc.gov/mcd-icd10.html on January 13, 2022. CDC WONDER data set documentation and technical methods can be accessed at https://wonder.cdc.gov/wonder/help/mcd.html#. Cause of death is defined as one of the multiple causes of death and is based on the International Classification of Diseases, 10th Rev. (ICD-10) codes B16, B17.0, B18.0, B18.1 (hepatitis B). UR Unreliable rate: Rates where death counts were <20 were not displayed because of the instability associated with those rates. S Suppressed: Subnational data representing <10 deaths (0 9) are suppressed or CDC WONDER did not have the functionality to calculate rates. Centers for Disease Control and Prevention. Viral Hepatitis Surveillance Report United States, 2020.https://www.cdc.gov/hepatitis/statistics/2020surveillance/index.htm. Published September 2022.
Table 2.7 Part 2 of 4 Numbers and rates* of deaths with hepatitis B virus infection listed as a cause of death among residents, by state or jurisdiction United States, 2016 2020 State or Jurisdiction No. Rate* No. Rate* Illinois 40 0.28 30 0.19 2016 2016 2017 2017 2018 No. 31 2018 Rate* 0.2 UR UR UR 2019 No. 25 2019 Rate* 0.17 2020 No. 36 2020 Rate* 0.24 Indiana Iowa 26 16 0.32 UR UR 29 15 0.34 UR UR 16 19 21 11 0.26 UR UR 27 S 0.37 UR UR Kansas 15 11 12 13 14 Kentucky 36 0.72 35 0.75 47 0.98 37 0.77 40 0.83 Louisiana 26 S 31 32 27 0.49 UR 0.43 0.37 0.18 30 S 31 36 28 0.53 UR 0.43 0.47 0.22 36 S 37 28 33 0.6 UR 0.52 0.36 0.25 31 S 39 22 23 0.55 UR 0.53 0.24 0.17 31 S 44 28 31 0.56 UR 0.57 0.3 0.25 Maine Maryland Massachusetts Michigan Minnesota Mississippi Missouri 25 22 13 0.42 0.64 UR 21 23 19 0.3 0.67 UR 33 20 24 0.51 0.61 0.31 48 25 19 0.7 0.72 UR 45 23 18 0.65 0.61 UR * Rates are age-adjusted per 100,000 US standard population during 2000 by using the following age group distribution (in years): <1, 1 4, 5 14, 15 24, 25 34, 35 44, 45 54, 55 64, 65 74, 75 84, and 85. For age-adjusted death rates, the age-specific death rate is rounded to 1 decimal place before proceeding to the next step in the calculation of age-adjusted death rates for NCHS Multiple Cause of Death on CDC WONDER. This rounding step might affect the precision of rates calculated for small numbers of deaths. Missing data are not included. Source: CDC, National Center for Health Statistics, Multiple Cause of Death 1999 2020 on CDC WONDER Online Database. Data are from the 2016 2020 Multiple Cause of Death files and are based on information from all death certificates filed in the vital records offices of the 50 states and the District of Columbia through the Vital Statistics Cooperative Program. Deaths of nonresidents (e.g., nonresident aliens, nationals living abroad, residents of Puerto Rico, Guam, the Virgin Islands, and other US territories) and fetal deaths are excluded. Numbers are slightly lower than previously reported for 2015 2016 because of NCHS standards that restrict displayed data to US residents. Accessed at http://wonder.cdc.gov/mcd-icd10.html on January 13, 2022. CDC WONDER data set documentation and technical methods can be accessed at https://wonder.cdc.gov/wonder/help/mcd.html#. Cause of death is defined as one of the multiple causes of death and is based on the International Classification of Diseases, 10th Rev. (ICD-10) codes B16, B17.0, B18.0, B18.1 (hepatitis B). UR Unreliable rate: Rates where death counts were <20 were not displayed because of the instability associated with those rates. S Suppressed: Subnational data representing <10 deaths (0 9) are suppressed or CDC WONDER did not have the functionality to calculate rates. Centers for Disease Control and Prevention. Viral Hepatitis Surveillance Report United States, 2020.https://www.cdc.gov/hepatitis/statistics/2020surveillance/index.htm. Published September 2022.
Table 2.7 Part 3 of 4 Numbers and rates* of deaths with hepatitis B virus infection listed as a cause of death among residents, by state or jurisdiction United States, 2016 2020 State or Jurisdiction No. Rate* No. Rate* Montana S UR S UR Nebraska S UR S UR Nevada 23 0.66 13 UR New Hampshire S UR S UR New Jersey 39 0.34 43 0.43 New Mexico S UR S UR New York 138 0.6 123 0.5 North Carolina 42 0.37 36 0.29 S UR S UR Ohio 44 0.34 55 0.42 Oklahoma 43 0.95 40 0.95 2016 2016 2017 2017 2018 No. S 10 20 S 41 S 115 35 S 42 54 2018 Rate* UR UR 0.51 UR 0.39 UR 0.47 0.27 UR 0.32 1.16 2019 No. S S 16 S 34 S 113 39 S 49 45 2019 Rate* UR UR UR UR 0.29 UR 0.48 0.29 UR 0.36 0.98 2020 No. S 10 16 S 29 S 125 38 S 53 37 2020 Rate* UR UR UR UR 0.26 UR 0.5 0.3 UR 0.39 0.74 North Dakota Oregon Pennsylvania 27 41 0.54 0.25 29 35 0.52 0.2 23 34 0.45 0.22 42 37 0.78 0.25 44 31 0.82 0.19 * Rates are age-adjusted per 100,000 US standard population during 2000 by using the following age group distribution (in years): <1, 1 4, 5 14, 15 24, 25 34, 35 44, 45 54, 55 64, 65 74, 75 84, and 85. For age-adjusted death rates, the age-specific death rate is rounded to 1 decimal place before proceeding to the next step in the calculation of age-adjusted death rates for NCHS Multiple Cause of Death on CDC WONDER. This rounding step might affect the precision of rates calculated for small numbers of deaths. Missing data are not included. Source: CDC, National Center for Health Statistics, Multiple Cause of Death 1999 2020 on CDC WONDER Online Database. Data are from the 2016 2020 Multiple Cause of Death files and are based on information from all death certificates filed in the vital records offices of the 50 states and the District of Columbia through the Vital Statistics Cooperative Program. Deaths of nonresidents (e.g., nonresident aliens, nationals living abroad, residents of Puerto Rico, Guam, the Virgin Islands, and other US territories) and fetal deaths are excluded. Numbers are slightly lower than previously reported for 2015 2016 because of NCHS standards that restrict displayed data to US residents. Accessed at http://wonder.cdc.gov/mcd-icd10.html on January 13, 2022. CDC WONDER data set documentation and technical methods can be accessed at https://wonder.cdc.gov/wonder/help/mcd.html#. Cause of death is defined as one of the multiple causes of death and is based on the International Classification of Diseases, 10th Rev. (ICD-10) codes B16, B17.0, B18.0, B18.1 (hepatitis B). UR Unreliable rate: Rates where death counts were <20 were not displayed because of the instability associated with those rates. S Suppressed: Subnational data representing <10 deaths (0 9) are suppressed or CDC WONDER did not have the functionality to calculate rates. Centers for Disease Control and Prevention. Viral Hepatitis Surveillance Report United States, 2020.https://www.cdc.gov/hepatitis/statistics/2020surveillance/index.htm. Published September 2022.
Table 2.7 Part 4 of 4 Numbers and rates* of deaths with hepatitis B virus infection listed as a cause of death among residents, by state or jurisdiction United States, 2016 2020 State or Jurisdiction No. Rate* No. Rate* Rhode Island S UR S UR South Carolina 38 0.6 26 0.39 South Dakota S UR S UR Tennessee 55 0.71 63 0.83 Texas 149 0.51 150 0.51 Utah S UR 11 UR Vermont S UR S UR Virginia 23 0.24 29 0.3 Washington 47 0.55 47 0.56 West Virginia 11 UR 14 UR Wisconsin 19 UR 21 0.31 Wyoming S UR S UR Total 1,690 0.45 1,727 0.46 2016 2016 2017 2017 2018 No. 11 26 S 50 119 S S 28 53 23 19 S 1,649 2018 Rate* UR 0.42 UR 0.61 0.4 UR UR 0.28 0.57 1.26 UR UR 0.43 2019 No. S 17 S 63 135 S S 20 50 18 S S 1,662 2019 Rate* UR UR UR 0.87 0.43 UR UR 0.18 0.54 UR UR UR 0.42 2020 No. S 25 S 56 141 S S 36 50 15 20 S 1,752 2020 Rate* UR 0.38 UR 0.73 0.44 UR UR 0.34 0.53 UR 0.27 UR 0.45 * Rates are age-adjusted per 100,000 US standard population during 2000 by using the following age group distribution (in years): <1, 1 4, 5 14, 15 24, 25 34, 35 44, 45 54, 55 64, 65 74, 75 84, and 85. For age-adjusted death rates, the age-specific death rate is rounded to 1 decimal place before proceeding to the next step in the calculation of age-adjusted death rates for NCHS Multiple Cause of Death on CDC WONDER. This rounding step might affect the precision of rates calculated for small numbers of deaths. Missing data are not included. Source: CDC, National Center for Health Statistics, Multiple Cause of Death 1999 2020 on CDC WONDER Online Database. Data are from the 2016 2020 Multiple Cause of Death files and are based on information from all death certificates filed in the vital records offices of the 50 states and the District of Columbia through the Vital Statistics Cooperative Program. Deaths of nonresidents (e.g., nonresident aliens, nationals living abroad, residents of Puerto Rico, Guam, the Virgin Islands, and other US territories) and fetal deaths are excluded. Numbers are slightly lower than previously reported for 2015 2016 because of NCHS standards that restrict displayed data to US residents. Accessed at http://wonder.cdc.gov/mcd-icd10.html on January 13, 2022. CDC WONDER data set documentation and technical methods can be accessed at https://wonder.cdc.gov/wonder/help/mcd.html#. Cause of death is defined as one of the multiple causes of death and is based on the International Classification of Diseases, 10th Rev. (ICD-10) codes B16, B17.0, B18.0, B18.1 (hepatitis B). UR Unreliable rate: Rates where death counts were <20 were not displayed because of the instability associated with those rates. S Suppressed: Subnational data representing <10 deaths (0 9) are suppressed or CDC WONDER did not have the functionality to calculate rates. Centers for Disease Control and Prevention. Viral Hepatitis Surveillance Report United States, 2020.https://www.cdc.gov/hepatitis/statistics/2020surveillance/index.htm. Published September 2022.