Guidelines for Host Range Data Card Creation in Phage Research
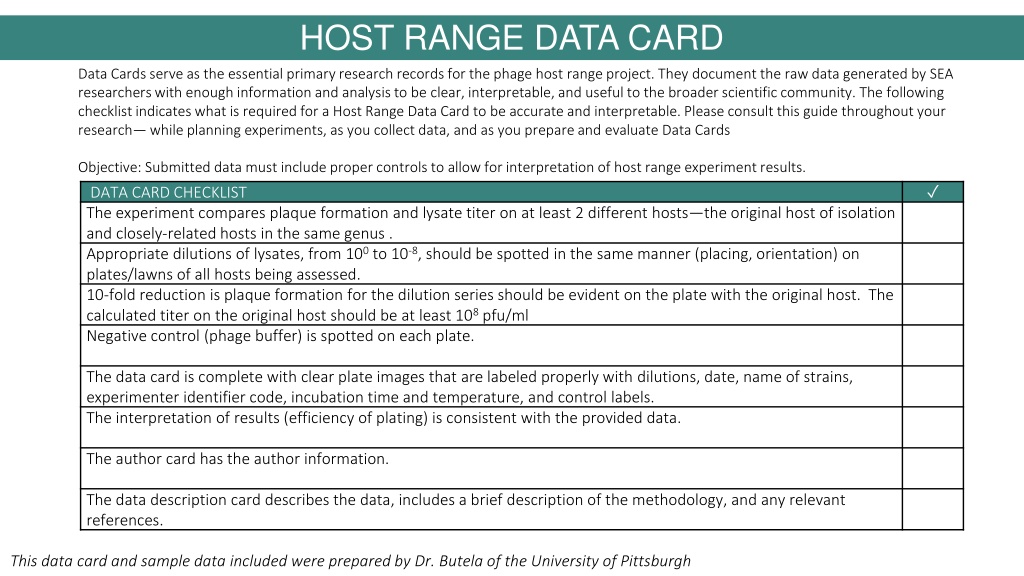
Essential checklist for creating accurate and interpretable Host Range Data Cards in phage host range projects, detailing required experiment components, controls, data documentation, and analysis. The provided checklist ensures the inclusion of necessary information and proper formatting for clear and meaningful research records. It emphasizes the comparison of plaque formation and lysate titer on different hosts, proper dilutions, consistent labeling, controls, and interpretation guidelines to support broader scientific understanding and reproducibility.
Download Presentation

Please find below an Image/Link to download the presentation.
The content on the website is provided AS IS for your information and personal use only. It may not be sold, licensed, or shared on other websites without obtaining consent from the author. Download presentation by click this link. If you encounter any issues during the download, it is possible that the publisher has removed the file from their server.
E N D
Presentation Transcript
HOST RANGE DATA CARD Data Cards serve as the essential primary researchrecords for the phage host range project. They document the raw data generated by SEA researchers with enough information and analysis to be clear, interpretable, and useful to the broader scientific community. The following checklistindicates what is required for a Host Range Data Card to be accurate and interpretable. Please consult this guide throughout your research while planning experiments, as you collect data, and as you prepare and evaluate Data Cards Objective: Submitted data must include proper controls to allow for interpretation of host range experiment results. DATA CARD CHECKLIST The experiment compares plaque formation and lysate titer on at least 2 different hosts the original host of isolation and closely-related hosts in the same genus . Appropriate dilutions of lysates, from 100to 10-8, should be spotted in the same manner (placing, orientation) on plates/lawns of all hosts being assessed. 10-fold reduction is plaque formation for the dilution series should be evident on the plate with the original host. The calculated titer on the original host should be at least 108pfu/ml Negative control (phage buffer) is spotted on each plate. The data card is complete with clear plate images that are labeled properly with dilutions, date, name of strains, experimenter identifier code, incubation time and temperature, and control labels. The interpretation of results (efficiency of plating) is consistent with the provided data. The author card has the author information. The data description card describes the data, includes a brief description of the methodology, and any relevant references. This data card and sample data included were prepared by Dr. Butela of the University of Pittsburgh
HOST RANGE DATA CARD INSTRUCTIONS 1. Complete the host range experiment using Protocol 11.5 in the Phage Discovery Guide. 2. Using the template data card provided in this slide deck, insert a high-resolution photograph of the entire spot-titer plates -- one perform using the original isolation host and one for the alternative host. Prepare a similar data card for each additional alternative host tested in your experiment. Place the plate containing the original isolation host on the left and the plate containing the alternative experimental host on the right. Label each with the appropriate host and phage name in a text box below the image. In the text box at the very top of the slide, indicate how long the plates were incubated at 30 C. Rotate each image so that the spotting pattern is the same, making interpretation easier. If your labeling on the plate is not visible in the photograph are not visible, label each dilution spot with the appropriate dilution factor (100, 10-1, 10-2, etc.) in text boxes centered at the bottom of each dilution spot. If your negative control spot s label isn t visible on the plate, label the negative control spot on each plate with - in a text box centered at the bottom of that spot. 3. Calculate the titer of your phage on each host (see protocol 11.5 for guidance)/ Note: If you did not observe a ~10-fold decrease of plaques as you move down the dilution series, record dilution error in the titer column. 10. Calculate the Efficiency of Plating and record your interpretations (see protocol 11.5 for guidance). 11. Complete the template data card, author cover card, and data description cards. Submit these cards to sea@hhmi.orgfor considerations for publication on QUBES as part of SEA Research.
SAMPLE DATA CARD 1.6 x 10⁻⁸ Efficiency of plating: titer on alternative host/ titer on isolation host Interpretation: Phage may infect the alternate host, Gordonia lacunae, but more experiments would be needed to confirm this result since single plaques weren t found on this plate. The clearing observed at the 10^0 square is either a result of "killing from without" in which some bacterial cells die not because of infection from the phage, but because they endure stress as a result of the presence of a large concentration of phages. The fact that no plaques or clearings were observed in any of the other squares/ lanes suggests "killing from without" as well. Isolation Host Gordonia terrae Alternative Host Gordonia lacunae Incubation temperature 30 C Incubation temperature 30 C Alternatively, we cannot observe plaques due to the grainy appearance of the G. lacunae lawn. Performing a Full Plate Titer on this host is recommended as a next step. If plaques are observed, then PantheRoc can infect G. lacunae. If no plaques are observed, then we can conclude the clearing on this plate is killing from without. Incubation durations (days) 5 days Incubation durations (days) 5 days Phage PantheRoc Phage PantheRoc 2 x 10¹⁰pfu/ml 3 x 10²pfu/ml Titer, pfu/ml (from plate above) Titer, pfu/ml (from plate above)
AUTHOR CARD Title: Authors: Author Affiliations: Corresponding Author Email:
TEMPLATE DATA CARD Efficiency of plating: titer on alternative host/ titer on isolation host Isolation Host Alternative Host Incubation temperature Incubation temperature Interpretation: Incubation durations (days) Incubation durations (days) Phage Phage Titer, pfu/ml (from plate above) Titer, pfu/ml (from plate above)
DATA DESCRIPTIONS CARD Description of Data and Observations: Replace this text with a brief description of your data and your interpretation. Methods: Replace this text with any deviations from the protocol for host range experiments (protocol 11.5). Otherwise, state no no deviations for standard protocol References: Replace this text with any relevant references
