Graphing Exponential Functions Relationship
Relationship between exponential functions with the same base, understanding compressions, reflections, translations, and transformations in graphing. Practice plotting points, identifying intercepts, and determining asymptotes. Use visual aids to model graphs and analyze temperature readings for real-world applications.

Download Presentation

Please find below an Image/Link to download the presentation.
The content on the website is provided AS IS for your information and personal use only. It may not be sold, licensed, or shared on other websites without obtaining consent from the author.If you encounter any issues during the download, it is possible that the publisher has removed the file from their server.
You are allowed to download the files provided on this website for personal or commercial use, subject to the condition that they are used lawfully. All files are the property of their respective owners.
The content on the website is provided AS IS for your information and personal use only. It may not be sold, licensed, or shared on other websites without obtaining consent from the author.
E N D
Presentation Transcript
7-2 Graphing Exponential Functions Today s Objective: I can graph any exponential function.
f and g are exponential functions with the same base. g f The graph of g is a ______ of the graph of f . A. compression B. reflection C. translation D. none of the above Justify your reasoning
? = ? ?? Stretch or compress ? = ? ?? + ? Right/Left (h) Up/Down (k) Parent Function: ? = ?? (1+h, ab+k) (1, ) ab (h, a+k) a (0, ) (1, ) b 1 (0, ) ? = ? To Graph: 1. Plot: y-intercept: (0, a) 2. Plot: 2nd Point: (1, ab) 3. Translate points and asymptote Asymptote y = k
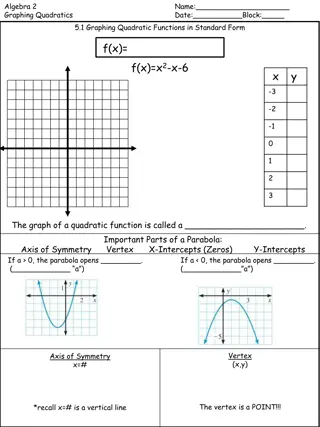
? = 2? ? = 3 2? y-intercept: 2nd Point: Translate: Asymptote: ? = ? ?? +? To Graph: 1. Plot: y-intercept: (0, a) 2. Plot: 2nd Point: (1, ab) 3. Translate points and asymptote Asymptote y = k y-intercept: 2nd Point: Translate: Asymptote: (0,1) (1,2) none (0,3) (1,6) none ? = 0 ? = 0 Domain: Range: All Real #s ? > 0 Domain: Range: All Real #s ? > 0
1 2 4? (0, (1,2) none ? = 2(4)? y-intercept: 2nd Point: Translate: Asymptote: ? = ? ?? +? To Graph: 1. Plot: y-intercept: (0, a) 2. Plot: 2nd Point: (1, ab) 3. Translate points and asymptote Asymptote y = k ? = (0, 2) (1, 8) none 12) y-intercept: 2nd Point: Translate: Asymptote: ? = 0 ? = 0 Domain: Range: All Real #s ? < 0 Domain: Range: All Real #s ? > 0
? = 2?+ 2 ? = 2? 3 y-intercept: 2nd Point: Translate: Asymptote: ? = ? ?? +? To Graph: 1. Plot: y-intercept: (0, a) 2. Plot: 2nd Point: (1, ab) 3. Translate points and asymptote Asymptote y = k (0,1) (1,2) 3 (0,1) (1,2) 2 y-intercept: 2nd Point: Translate: Asymptote: ? = 0 ? = 2 Domain: Range: All Real #s Domain: Range: All Real #s ? > 0 ? > 2
7-2 Graphing Exponential Functions Day 2 Today s Objective: I can graph any exponential function.
The best temperature to brew coffee is between 195F and 205F. Coffee is cool enough to drink at 185 F. The table shows temperature readings from a sample cup of coffee. Model this relationship. Temp less room temp (70 ) 133 107 83 67 51 Average Temp change per 5 min. = 21% decrease Temp change per minute 4.2% Time (min) 0 5 10 15 20 Temp ( F) 203 177 153 137 121 ??????? ???? ???????? ???? 203-70 = 0.80 ? = ? ?? + ? 177-70 = 0.78 ? =133 (0.96)?+70 153-70 = 0.81 137-70 = 0.76 121-70 =
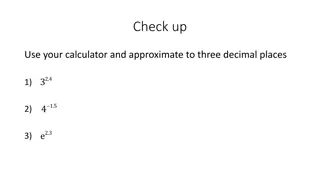
Continuous growth or decay You have $3000 to invest for 10 years at 5% annual rate with your choice of compounding. (yearly, quarterly, continuously) Yearly: ? ? = ? 1 + ?? ? 10 = 3000 1 + 0.0510 ? 10 = 4,886.68 Quarterly: ? ? = ? 1 +? ? ? 10 = 3000 1 +0.05 4 ? 10 = 4,930.86 Continuously: y 5 ? = ? ? ? = 1 +1 ? ?? 5 x ? = 2.718281828459 4(10) ? ? = ???? ? 10 = 3000?0.05 10 ? 10 = 4,946.16