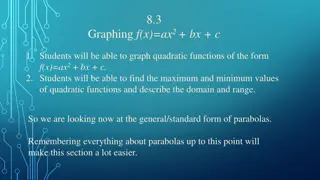
Graphing Absolute Value Functions
Explore the concept of graphing absolute value functions through transformations. Learn about the importance of the absolute value function, graphing techniques, vertex identification, and transformation variations. Practice examples provided for better understanding.

Download Presentation

Please find below an Image/Link to download the presentation.
The content on the website is provided AS IS for your information and personal use only. It may not be sold, licensed, or shared on other websites without obtaining consent from the author.If you encounter any issues during the download, it is possible that the publisher has removed the file from their server.
You are allowed to download the files provided on this website for personal or commercial use, subject to the condition that they are used lawfully. All files are the property of their respective owners.
The content on the website is provided AS IS for your information and personal use only. It may not be sold, licensed, or shared on other websites without obtaining consent from the author.
E N D
Presentation Transcript
Lesson 2.1 Graphing Absolute Value Functions
Absolute Value The distance from zero Will always be positive
Graphing Absolute Value through transformations
Graphing Absolute Value through transformations
Steps for graphing absolute through transformation Identify and graph the vertex (remember the vertex is (h,k) and h is always opposite sign) Use the a and a table to find and graph two more points one on each side of the vertex X f(x) af(x) X represents the distance to move over from the vertex I always use one F(x) will be the parent function IxI how much we move up and down if there is no a af(x) will be the parent function IxI times a (the stretch or compression) how much we move up or down if there is an a in the equation
Example Graph y=Ix +3I
Example Graph y=IxI - 5
Example Graph y=2IxI
Example Graph y=1/2Ix +3I - 2
Example Graph y= -3Ix 2I +4
You Try Graph y=2Ix + 1I 1
Graph to equation What is the equation of this graph
Homework Worksheet pg. 111 1-27 odds, 29 and 30 Directions for 1-27 odds Describe the transformation Identify the vertex Graph Find Domain and Range