Fundamentals of Block Diagram Algebra
F
UNDAMENTAL
OF
B
LOCK
D
IAGRAM
A
LGEBRA
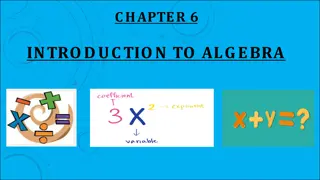
I
NTRODUCTION
Block diagram is a shorthand, graphical
representation of a physical system, illustrating
the functional relationships among its
components.
OR
A Block Diagram is a shorthand pictorial
representation of the cause-and-effect
relationship of a system.
I
NTRODUCTION
The simplest form of the block diagram is the single
block, with one input and one output.
The interior of the rectangle representing the block
usually contains a description of or the name of the
element, or the symbol for the mathematical operation to
be performed on the input to yield the output.
The arrows represent the direction of information or
signal flow.
I
NTRODUCTION
The operations of addition and subtraction have a special
representation.
The block becomes a small circle, called a summing point,
with the appropriate plus or minus sign associated with
the arrows entering the circle.
Any number of inputs may enter a summing point.
The output is the algebraic sum of the inputs.
Some books put a cross in the circle.
C
OMPONENTS
OF
A
B
LOCK
D
IAGRAM
FOR
A
L
INEAR
T
IME
I
NVARIANT
S
YSTEM
System components are alternatively called elements
of the system.
Block diagram has four components:
Signals
System/ block
Summing junction
Pick-off/ Take-off point
In order to have the same signal or variable be an input
to more than one block or summing point, a takeoff point
is used.
Distributes the input signal, undiminished, to several
output points.
This permits the signal to proceed unaltered along
several different paths to several destinations.
E
XAMPLE
-1
Consider the following equations in which x
1
, x
2
, x
3
, are
variables, and
a
1
, a
2
are
general coefficients or
mathematical operators.
E
XAMPLE
-1
Consider the following equations in which x
1
, x
2
, x
3
, are
variables, and
a
1
, a
2
are
general coefficients or
mathematical operators.
E
XAMPLE
-2
Consider the following equations in which x
1
, x
2
,. . . , x
n
,
are variables, and
a
1
, a
2
,. . . , a
n
, are
general coefficients
or mathematical operators.
E
XAMPLE
-3
Draw the Block Diagrams of the following equations.
T
OPOLOGIES
We will now examine some common topologies for
interconnecting subsystems and derive the single
transfer function representation for each of them.
These common topologies will form the basis for
reducing more complicated systems to a single
block.
CASCADE
•
Any finite number of blocks in series may be
algebraically combined by multiplication of
transfer functions.
•
That is,
n components or blocks with transfer
functions G
1
, G
2
, . . . , G
n
, connected in cascade
are equivalent to a single element G with a
transfer function given by
E
XAMPLE
Multiplication of transfer functions is
commutative; that is,
GiGj = GjGi
for any i or
j .
C
ASCADE
:
Figure:
a) Cascaded Subsystems.
b) Equivalent Transfer Function.
The equivalent transfer function
is
P
ARALLEL
F
ORM
:
Parallel subsystems have a common input and an output
formed by the algebraic sum of the outputs from all of the
subsystems.
Figure: Parallel Subsystems.
P
ARALLEL
F
ORM
:
Figure:
a) Parallel Subsystems.
b) Equivalent Transfer Function.
The equivalent transfer function is
F
EEDBACK
F
ORM
:
The third topology is the feedback form. Let us derive the
transfer function that represents the system from its
input to its output. The typical feedback system, shown
in figure:
Figure: Feedback (Closed Loop) Control System.
T
h
e
s
y
s
t
e
m
i
s
s
a
i
d
t
o
h
a
v
e
n
e
g
a
t
i
v
e
f
e
e
d
b
a
c
k
i
f
t
h
e
s
i
g
n
a
t
t
h
e
s
u
m
m
i
n
g
j
u
n
c
t
i
o
n
i
s
n
e
g
a
t
i
v
e
a
n
d
p
o
s
i
t
i
v
e
f
e
e
d
b
a
c
k
i
f
t
h
e
s
i
g
n
i
s
p
o
s
i
t
i
v
e
.
F
EEDBACK
F
ORM
:
Figure:
a)
Feedback Control System.
b)
Simplified Model or
Canonical Form
.
c) Equivalent Transfer Function.
The equivalent or closed-loop
transfer function is
C
HARACTERISTIC
E
QUATION
•
The control ratio is the closed loop transfer function of the
system.
•
The denominator of closed loop transfer function determines the
characteristic equation of the system.
•
Which is usually determined as:
C
ANONICAL
F
ORM
OF
A
F
EEDBACK
C
ONTROL
S
YSTEM
The system is said to have negative feedback if the sign at the summing
junction is negative and positive feedback if the sign is positive.
1.
Open loop transfer function
2.
Feed Forward Transfer function
3.
control ratio
4.
feedback ratio
5.
error ratio
6.
closed loop transfer function
7.
characteristic equation
8.
closed loop poles and zeros if K=10.
C
HARACTERISTIC
E
QUATION
U
NITY
F
EEDBACK
S
YSTEM
Graphical representation illustrating the functional relationships among components in a system. It serves as a cause-and-effect pictorial shorthand, showcasing the relationship and flow of signals. The diagram features various components such as single blocks, summing points, and pick-off points, each representing different aspects of a system. Addition and subtraction operations are uniquely represented within the diagram to facilitate understanding and analysis. Explore the fundamental concepts of block diagram algebra and the components that make up a linear time-invariant system with clear examples and explanations.

Download Presentation

Please find below an Image/Link to download the presentation.
The content on the website is provided AS IS for your information and personal use only. It may not be sold, licensed, or shared on other websites without obtaining consent from the author.If you encounter any issues during the download, it is possible that the publisher has removed the file from their server.
You are allowed to download the files provided on this website for personal or commercial use, subject to the condition that they are used lawfully. All files are the property of their respective owners.
The content on the website is provided AS IS for your information and personal use only. It may not be sold, licensed, or shared on other websites without obtaining consent from the author.
E N D
Presentation Transcript
FUNDAMENTAL OF BLOCK DIAGRAM ALGEBRA
INTRODUCTION Block representation of a physical system, illustrating the functional relationships components. OR A Block Diagram is representation of relationship of a system. diagram is a shorthand, graphical among its a the shorthand cause-and-effect pictorial
INTRODUCTION The simplest form of the block diagram is the single block, with one input and one output. The interior of the rectangle representing the block usually contains a description of or the name of the element, or the symbol for the mathematical operation to be performed on the input to yield the output. The arrows represent the direction of information or signal flow. d x y dt
INTRODUCTION The operations of addition and subtraction have a special representation. The block becomes a small circle, called a summing point, with the appropriate plus or minus sign associated with the arrows entering the circle. Any number of inputs may enter a summing point. The output is the algebraic sum of the inputs. Some books put a cross in the circle.
COMPONENTS OF A BLOCK DIAGRAM FOR A LINEAR TIME INVARIANT SYSTEM System components are alternatively called elements of the system. Block diagram has four components: Signals System/ block Summing junction Pick-off/ Take-off point
In order to have the same signal or variable be an input to more than one block or summing point, a takeoff point is used. Distributes the input signal, undiminished, to several output points. This permits the signal to proceed unaltered along several different paths to several destinations.
EXAMPLE-1 Consider the following equations in which x1, x2, x3, are variables, and a1, a2 are mathematical operators. general coefficients or = + x a x a x 5 3 1 1 2 2
EXAMPLE-1 Consider the following equations in which x1, x2, x3, are variables, and a1, a2 are mathematical operators. = x a x general coefficients or + a x 5 3 1 1 2 2
EXAMPLE-2 Consider the following equations in which x1, x2,. . . , xn, are variables, and a1, a2,. . . , an, are general coefficients or mathematical operators. = + + x a x a x a x n n n 1 1 2 2 1 1
EXAMPLE-3 Draw the Block Diagrams of the following equations. dx 1 b 1 ) = + ( x a x dt 1 2 1 1 dt 2 d x dx 2 1 ) = + ( x a bx 2 3 3 1 1 2 dt dt
TOPOLOGIES We will now examine some common topologies for interconnecting subsystems and derive the single transfer function representation for each of them. These common topologies will form the basis for reducing more complicated systems to a single block.
CASCADE Any finite number of blocks in series may be algebraically combined by multiplication of transfer functions. That is, n components or blocks with transfer functions G1, G2, . . . , Gn, connected in cascade are equivalent to a single element G with a transfer function given by
EXAMPLE Multiplication of transfer functions is commutative; that is, GiGj = GjGi for any i or j .
CASCADE: Figure: a) Cascaded Subsystems. b) Equivalent Transfer Function. The equivalent transfer function is
PARALLEL FORM: Parallel subsystems have a common input and an output formed by the algebraic sum of the outputs from all of the subsystems. Figure: Parallel Subsystems.
PARALLEL FORM: Figure: a) Parallel Subsystems. b) Equivalent Transfer Function. The equivalent transfer function is
FEEDBACK FORM: The third topology is the feedback form. Let us derive the transfer function that represents the system from its input to its output. The typical feedback system, shown in figure: Figure: Feedback (Closed Loop) Control System. The system is said to have negative feedback if the sign at the summing junction is negative and positive feedback if the sign is positive.
FEEDBACK FORM: Figure: a) Feedback Control System. b) Simplified Model or Canonical Form. c) Equivalent Transfer Function. The equivalent or closed-loop transfer function is
CHARACTERISTIC EQUATION The control ratio is the closed loop transfer function of the system. ( ) ( s ) H C s G s =1 ( ) ( ) ( ) R s G s The denominator of closed loop transfer function determines the characteristic equation of the system. Which is usually determined as: = ( ) ( ) G s H s 1 0
CANONICAL FORMOFA FEEDBACK CONTROL SYSTEM The system is said to have negative feedback if the sign at the summing junction is negative and positive feedback if the sign is positive.
( ) B s = ( ) ( ) G s H s 1. Open loop transfer function ( ) E s C ( ) s 2. Feed Forward Transfer function = ( ) G s ( ) E s (s ) G ( ) ( s ) H C s G s =1 3. control ratio + ( ) ( ) ( ) R s G s ( ) ( G ) ( ) B s G + s H s 4. feedback ratio =1 ( ) ( ) ( ) R s s H s (s ) H ( ) E s 1 5. error ratio =1 + ( ) ( ) ( ) R s G s H s ( ) ( s ) H C s G s =1 6. closed loop transfer function + ( ) ( ) ( ) R s G s 7. characteristic equation + = ( ) ( ) G s H s 1 0 8. closed loop poles and zeros if K=10.