SLRCA Driver Diagram & Change Ideas 2019

SLRCA Driver Diagram &
Change Ideas
2019
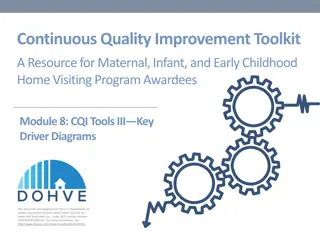
Overall primary regional project aim
Improve definitive vascular access rates to 80%
Improve definitive access rates to 65%
Reach a day case rate of 70% (GIRFT)
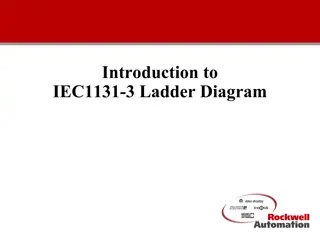
VA Driver Diagram – Developed August 2019 – Starting QI
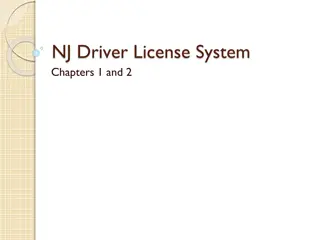
Barriers
3
Late referrals for
access < eGFR 15
Pathway taking too
long & not
measured routinely
Access to surgery –
varied access to day
case surgery
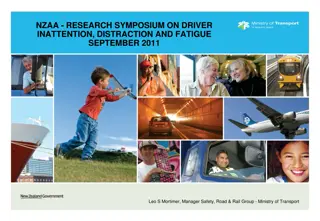
Change ideas -
4
Collaboration with AKCC –
e-referral and checklist
Monitor 2 week referral
for surgical assessment
Develop and implement
pathways of good
practice 1&2
RCA on each line from
AKC to HD
Define day case criteria
Standardise approach
In this document, the SLRCA Driver Diagram & Change Ideas for 2019 are presented, focusing on improving vascular access rates through various strategies and interventions. The diagram outlines key drivers, interventions, aims, and strategies to achieve improvements in patient care and operational efficiency. Barriers such as access to surgery and late referrals are identified, along with proposed change ideas to address these challenges. The goal is to enhance decision-making processes and streamline pathways for better patient outcomes.

Download Presentation

Please find below an Image/Link to download the presentation.
The content on the website is provided AS IS for your information and personal use only. It may not be sold, licensed, or shared on other websites without obtaining consent from the author.If you encounter any issues during the download, it is possible that the publisher has removed the file from their server.
You are allowed to download the files provided on this website for personal or commercial use, subject to the condition that they are used lawfully. All files are the property of their respective owners.
The content on the website is provided AS IS for your information and personal use only. It may not be sold, licensed, or shared on other websites without obtaining consent from the author.
E N D
Presentation Transcript
SLRCA Driver Diagram & Change Ideas 2019
VA Driver Diagram Developed August 2019 Starting QI Add primary driver Add secondary driver Add intervention Add aim Key: In order to achieve this aim.. We need to ensure... Which requires... Ideas to ensure this happens Regular meetings/webinars Monthly meetings/webinars Leadership and vision Staff awareness and engagement Qi visitsto teams -monthly PPI Involvementof patients in planning Vascularaccess that is timely, right for the patient and supported by SDM Skilled and competent Implement staff teaching -MAGIC Workforce Clinic and theatre capacity Process map against proposed Improve definitive access in prevelant patients to 80% ( not including PD) Education developand implement staff awareness initiatives Agree and implement clinical pathways Improve definitive access in incident patients to 65% Process map against proposed pathways to understand gaps Pathways Agree data collection Collect baseline data and ongoing KPI's Overall primary regional project aim Improve definitive vascular access rates to 80% Improve definitive access rates to 65% Reach a day case rate of 70% (GIRFT) IT support Develop dashboard and screens for monthly reports
Barriers Access to surgery varied access to day case surgery Pathway taking too long & not measured routinely Late referrals for access < eGFR 15 3
Change ideas - Define day case criteria Standardise approach Collaboration with AKCC e-referral and checklist Develop and implement pathways of good practice 1&2 Monitor 2 week referral for surgical assessment RCA on each line from AKC to HD 4