Flux Working Group Report and Synthesis Activities
The Flux Working Group, led by Co-chairs Reem Hannun and Brendan Byrne, focuses on quantifying carbon balance from point sources to global domains. Their goal is to provide data for understanding processes at various scales, developing models, and informing policy decisions. The group engages in various projects and synthesis activities, aiming to identify research priorities and uncertainties in carbon flux estimations.
Download Presentation

Please find below an Image/Link to download the presentation.
The content on the website is provided AS IS for your information and personal use only. It may not be sold, licensed, or shared on other websites without obtaining consent from the author.If you encounter any issues during the download, it is possible that the publisher has removed the file from their server.
You are allowed to download the files provided on this website for personal or commercial use, subject to the condition that they are used lawfully. All files are the property of their respective owners.
The content on the website is provided AS IS for your information and personal use only. It may not be sold, licensed, or shared on other websites without obtaining consent from the author.
E N D
Presentation Transcript
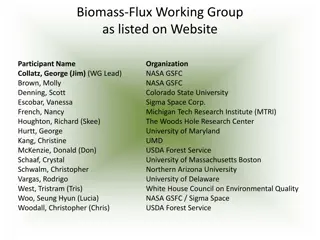
WG Flux Breakout Report Co-chairs: Reem Hannun and Brendan Byrne Hannah Nesser, Tao Zheng, Sha Feng, Prasad Bandaru, Nina Randazzo, Mallory Barnes, Andrew Schuh, Erin Delaria, Daniel Hayes, Will Richardson, Ben Runkle, Ying Sun
Goals The focus of the Flux Working Group is to determine and quantify the carbon balance of individual point sources to state or multi-state regions to hemispheric or global domains. These estimates of carbon fluxes and stocks are needed to help understand processes at various spatiotemporal scales, to help develop and test hypotheses, to provide inputs for models, and to provide estimates for policy needs, such as reporting GHG emissions and sinks to stakeholders and decision-makers. Current projects by the working group members estimate carbon fluxes using a variety of measurements and diagnostic modeling techniques, including top-down (atmospheric inversions) and bottom-up (process-based, inventory-based and bookkeeping) methods. The working group aims to facilitate communication between colleagues, to raise awareness of current work, to advance flux estimation methodologies, to identify community needs for observations, data synthesis and modeling, and to develop future research directions.
Flux WG encompasses a broad cross-section of CMS Projects spanning forest biomass, agriculture, blue carbon, anthropogenic emissions Many projects focus on different regions Scope/consensus on synthesis activities Identify future research priorities what are current questions or sources of uncertainty that emerge among different flux estimations?
Synthesis activities Case studies with existing data sets CMS evaluation study to support new NASA scoping studies (drylands, tropics) Barnes: upscaled tower eddy covariance (monthly, half degree) dryland carbon fluxes Can you use atmospheric inversions to constrain state-level carbon flux estimates? Break down of flux products at intermediate (e.g., state scales) Focus on homogenous states (e.g., not having to attribute ag vs. forest) Aggregate bottom-up estimates to state-level Caveats: atmospheric signal from any single state may be difficult for inverse model to resolve Extreme events: comparing temporal response in top-down and bottom-up estimates inventories have no interannual variability; what would medium-long-term impact on carbon stocks be? At what point does that signal show up in inventory Can you see in magnitude and mechanism of products Frequency and intensity of extreme events increasing Compare bottom up and top down over CONUS from 2015-2020 period using multiple data sets Do we see similar variability in two types of products; paths forward?; gradual changes? How do different data sets capture interannual variability in the US: where do you see signals diverge? Where do stakeholders fit in?
Synthesis activities inventory of CMS products End-user or application driven paper on CO2flux products within CMS Inventory of different studies identify flux products that exist, landing page to highlight flux products Publication of a collection of data sets Primer for stakeholder use
Notes from breakout session Synthesis study around what are questions/major concerns Case studies using existing data sets Geographic regions or sectors that are more important for policy E.g., lateral fluxes that inversions can t capture Inventories have good harvest data for forests (DOC) Where are the uncertainties limiting? Bottom-up estimates in prior to reduce uncertainties a lot of efforts in developing process-based models for crops, forests, etc Inventory of different studies identify flux products that exist, landing page to highlight flux products Publication of a collection of data sets Primer for stakeholder use Using OCO2-MIP 7 year global product, find areas of improvement White paper on how CMS supports new NASA scoping studies (drylands, tropics) Barnes: upscaled eddy covariance (monthly, half degree) upland carbon fluxes Can you use atmospheric inversions to constrain state-level carbon flux estimates? Break down of flux products at intermediate (e.g., state scales) focus on homogenous states (e.g., not having to attribute ag vs. forest) Atmospheric signal from single state may be small Top down applications depend on resolution of data data density problem Consider agriculture or forestry, compare bottom-up approaches with top-down products using just existing CMS products Aggregate bottom up estimates Case study using existing data sets: Focus on temporal changes related to extreme events (e.g., does bottom up give you same heat or drought related impact as top-down) inventories have no interannual variability; what would medium-long-term impact on carbon stocks be? At what point does that signal show up in inventory Can you see in magnitude and mechanism of products Frequency and intensity of extreme events increasing Compare bottom up and top down over CONUS from 2015-2020 period using multiple data sets do we see similar spatial variability in two types of products; paths forward; gradual change as well How do different data sets capture interannual variability in the US: where do you see signals regionally Where do stakeholders fit in?


